
The Bitcoin rainbow chart is a fun way of looking at the price chart for a longer term as it reduces the daily market noise. It uses color bands to illustrate the price movement, and investors can obtain market conditions through these band levels. This concept of the rainbow chart applies to any other financial instrument alongside Bitcoin.
However, it is mandatory to know the components and uses of any technical tool while executing successful trades using it. This article will enlighten the Bitcoin rainbow chart and sustainable trading strategies using the concept. Later, we will list the top three pros and cons to understand the potential.
hat is the Bitcoin rainbow chart?
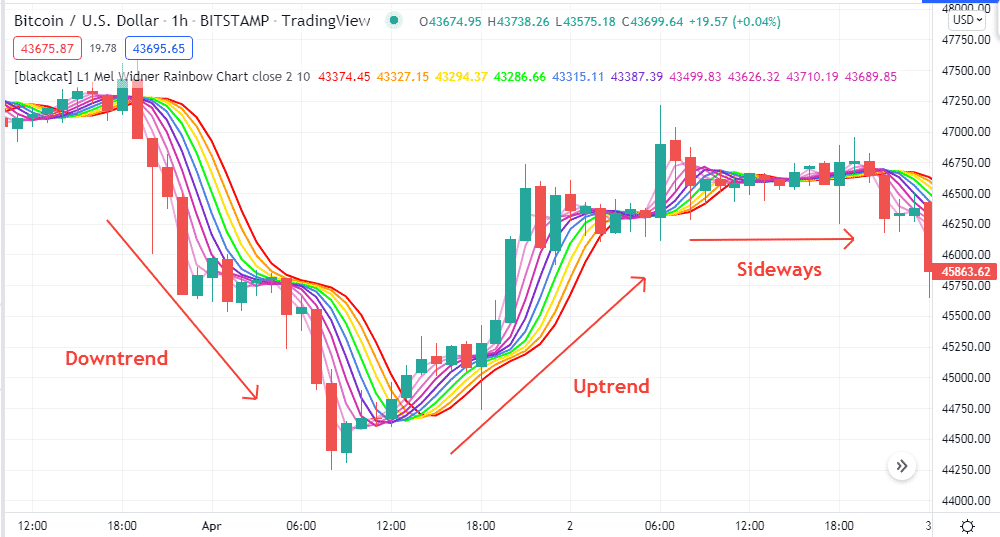
The rainbow chart is a reasonably straightforward technical indicator that contains ten different moving averages to illustrate the rainbow concept on the chart. These SMA lines create a channel and the price moves within the channel. When these lines get closer, it declares a sideways or consolidating phase.
Rainbow chart
Meanwhile, when the price moves sharply in any direction, these SMA lines get wider in an effective way that easily enables obtaining the market context. Skyblue SMA line remains with the price strictly, and the red SMA line remains on the other edge. Different other eight SMA lines stay between these two. The blue and yellow line are essential as it remains on the middle side of the rainbow.
How to trade using the Bitcoin rainbow chart
Using rainbow charts for successful trading is easy as you follow the crossover between the SMA lines. When the price reaches above the range of the rainbow, it declares sufficient ongoing bullish momentum.
The sky blue SMA reaches below the red SMA and all other SMA lines when the bearish pressure increases and vice versa. On the other hand, the price continues to touch below the indicator range, expressing bearish pressure on the asset price. You can use this concept independently to generate trade ideas or other supportive tools and indicators to create more effective trading strategies.
Crypto investors often use support resistance, Fibonacci retracement tools, or indicators like RSI, MACD, parabolic SAR, etc., to generate more effective trade ideas.
Short-term trading strategy
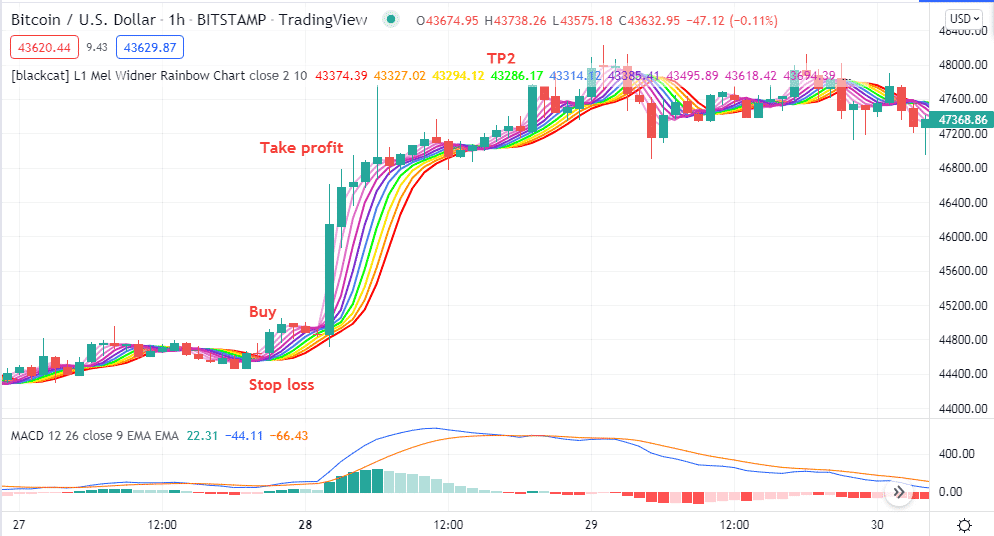
We use the rainbow chart and the MACD, a popular momentum indicator, to generate trade ideas in this trading method. You can apply this method in almost any trading instrument when the market is trending. As we seek short-term trading positions, we recommend using this method on at least a 15min or hourly chart to catch the best short-term trades.
Bullish trade scenario
Set indicators and observe the price reaches near a finish line of a downtrend, then match:
- The price goes above the rainbow indicator range.
- The sky blue SMA and all other SMA lines cross above the red SMA line.
- The dynamic blue line reaches above the dynamic red line on the MACD indicator window.
- MACD green histogram bars take place above the central line.
Bullish setup
Entry
Match these conditions above and open a buy position.
Stop loss
The initial stop loss will be below the current swing low.
Take profit
Close the buy order when:
- The price reaches below the rainbow indicator range.
- The sky blue SMA line crosses below the red SMA line and starts sloping on the downside.
- MACD red histogram bars take place below the central line.
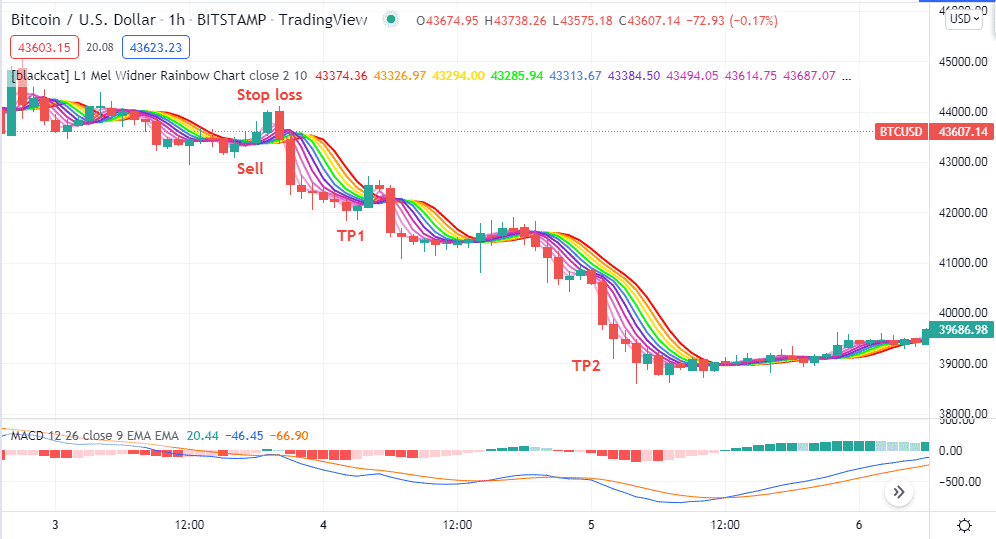
Bearish trade scenario
Set indicators and observe the price reaches near a finish line of an uptrend, then match:
- The price goes below the rainbow indicator range.
- The sky blue SMA and all other SMA lines cross below the red SMA line.
- The dynamic blue line reaches below the dynamic red line on the MACD indicator window.
- MACD red histogram bars take place below the central line.
Bearish setup
Entry
Match these conditions above and open a sell position.
Stop loss
The initial stop loss will be above the current swing high.
Take profit
Close the sell order when:
- The price reaches above the rainbow indicator range.
- The sky blue SMA line crosses above the red SMA line and starts sloping on the upside.
- MACD green histogram bars take place above the central line.
Long-term trading strategy
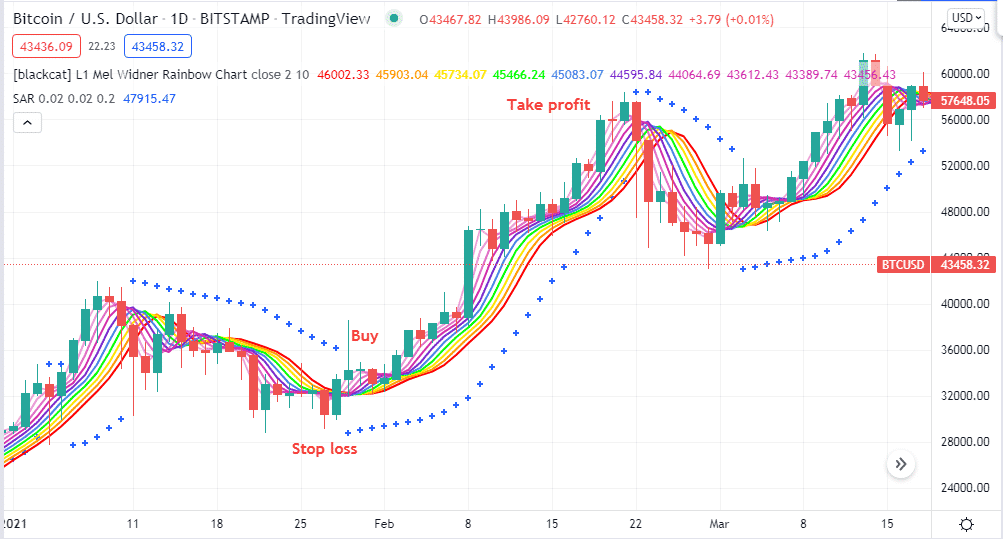
We use the parabolic SAR as a supportive indicator alongside the rainbow chart in this trading method. We suggest using a daily or H4 chart to catch the most potent long-term trades using this trading strategy.
Bullish trade scenario
This method suggests potential bullish pressure on the asset price when:
- The sky blue SMA line crosses above the red SMA line.
- All other SMA lines cross above the red SMA line and start to slope on the upside.
- Parabolic SAR dots take place on the bottom side of price candles.
Bullish setup
Entry
Check these conditions above and open a buy position.
Stop loss
Place an initial stop loss below the current bullish momentum.
Take profit
Continue the buy order till the price remains on the uptrend. Close the position when:
- The parabolic SAR dots switch on the upside of price candles.
- The price reaches below the range of the rainbow chart, and the red line continues to move on the upside of price candles.
Bearish trade scenario
This method suggests potential bearish pressure on the asset price when:
- The sky blue SMA line crosses below the red SMA line.
- All other SMA lines cross below the red SMA line and start to slope on the downside.
- Parabolic SAR dots take place on the upper side of price candles.
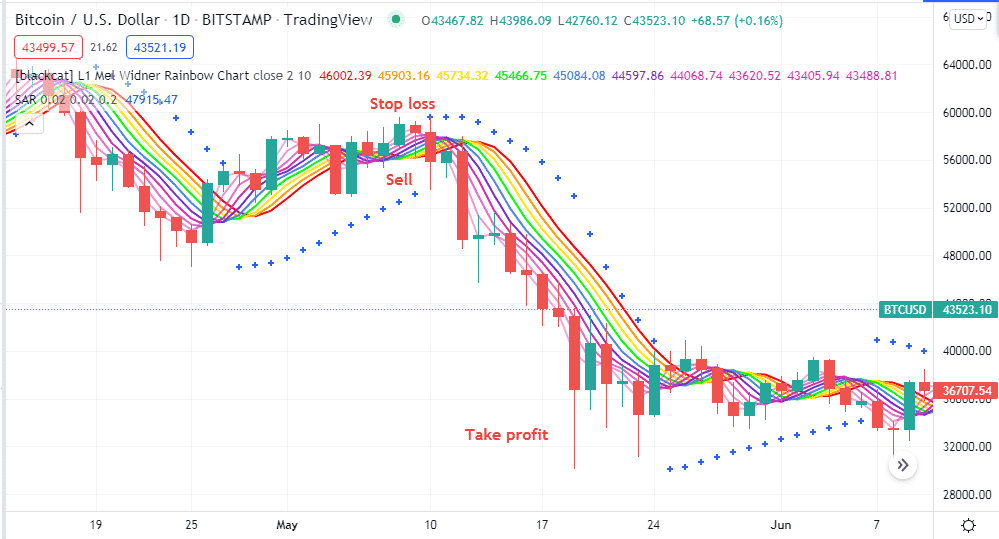
Bearish setup
Entry
Check these conditions above and open a sell position.
Stop loss
Place an initial stop loss above the current bearish momentum.
Take profit
Continue the sell order till the price remains on the downtrend. Close the position when:
- The parabolic SAR dots switch on the downside of price candles.
- The price reaches above the range of the rainbow chart, and the red line continues to move on the downside of price candles.
Pros and cons
| 👍 Pros | 👎 Cons |
|
|
|
|
|
|
Final thought
Finally, the rainbow chart is not investment advice; it helps investors obtain market context and make trade decisions. Meanwhile, don’t forget to follow efficient money and trade management rules alongside checking on fundamental info while using this concept to make trade decisions.


Comments