
The Triple Exponential Average (TRIX) is a powerful oscillator indicator to determine the market context. This indicator effectively uses the EMA concept to generate potentially profitable trade ideas. Crypto investors choose this indicator for its unique features and calculation type.
However, when you want to trade crypto assets using any technical indicator, knowing the components, calculations, and the most efficient using procedure to execute constantly profitable trades is mandatory.
This article will introduce you to the TRIX indicator alongside describing successful crypto trading strategies using this trading tool.
What is the TRIX indicator?
Financial investors use a momentum oscillator indicator to determine momentum, overbought and oversold areas while making trade decisions. Jack Hutson, an editor for Technical Analysis of Stocks and Commodities magazine, is the developer of the TRIX indicator in the early 1980s.
TRIX indicator
This indicator uses different EMA calculations to filter out market context.
Formulas for 20-periods of TRIX indicator include:
- Single-Smoothed EMA = EMA (20) of the closing price
- Double-Smoothed EMA = EMA (20) of Single-Smoothed EMA
- Triple-Smoothed EMA = EMA (20) of Double-Smoothed EMA
- TRIX = 1-period percent change in Triple-Smoothed EMA
You can modify the period for calculation. Many crypto investors are comfortable trading using a 14-periods value. TRIX indicator usually shows readings in an independent window containing a dynamic line and a central (0) line.
How to trade using the TRIX indicator?
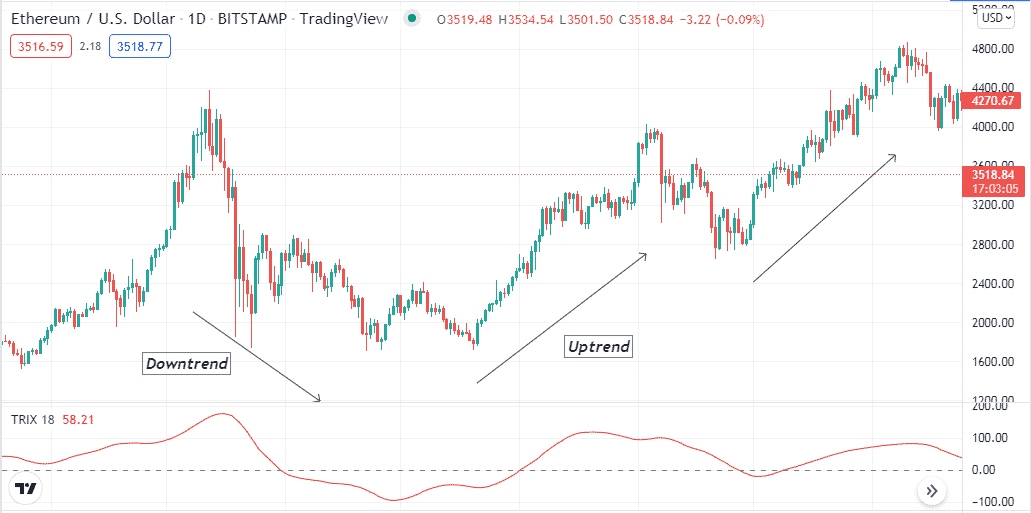
The tool is a straightforward tool containing a dynamic line and a zero line.
- When the dynamic line surpasses above the zero line, it declares an uptrend.
- When it reaches below the central (0) line confirms the price enters a downtrend.
The bullish momentum remains intact when the TRIX dynamic line continues to slop on the upside. Conversely, the price declines; the dynamic line slops on the downside. This concept you can use independently to generate trade ideas. Another popular method that financial traders use is the divergence of the dynamic TRIX line to generate trade decisions. Smart crypto investors often use other supportive technical tools and indicators to identify more effective trading positions. Many popular indicators, including RSI, MACD, MA, Parabolic SAR, support resistance, Fibo retracements, etc., are popular as supportive indicators and tools.
Short-term trading strategy
We use the RSI as a supportive indicator alongside the TRIX indicator to generate short-term trade ideas in this trading method. Combining the readings of all these two indicators makes it easier to determine current trends and trend switching points. We suggest applying this method on hourly or 15-min charts to catch the most potent short-term trades.
Bullish trade scenario
Apply both indicators to your target asset chart and observe when:
- The TRIX dynamic line reaches above the central (0) line.
- The RSI dynamic line reaches above the central (0) line and heads toward the upper (70) level.
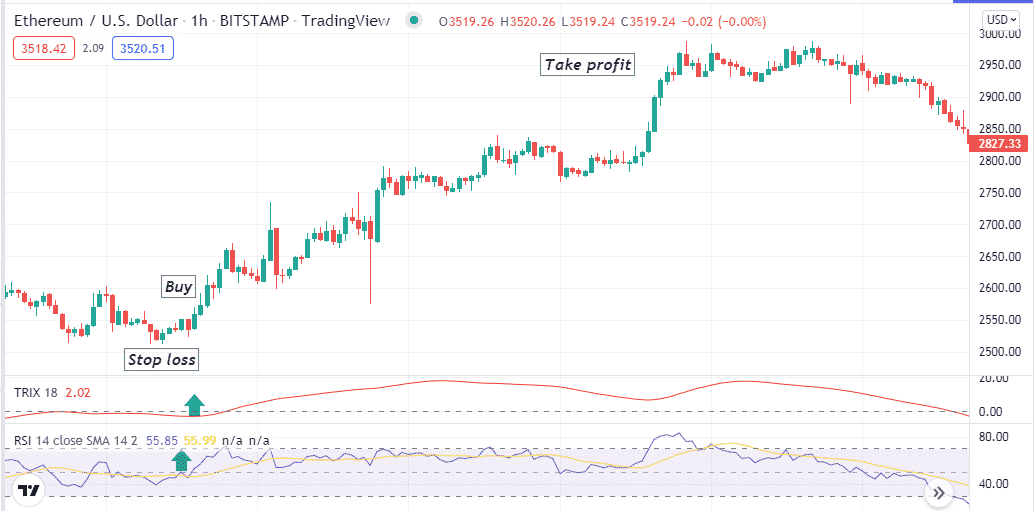
Bullish setup
Entry
Match these conditions above and place a buy order.
Stop loss
Place an initial stop loss below the recent swing low.
Take profit
Continue the buy order until the price remains on the uptrend or the TRIX indicator reading increases above the central (0) line. Close the buy order when:
- The TRIX indicator starts sloping on the downside.
- The RSI dynamic line reaches above the upper (70) line or starts to decline after reaching that level.
Bearish trade scenario
Apply both indicators to your target asset chart and observe when:
- The TRIX dynamic line reaches below the central (0) line.
- The RSI dynamic line reaches below the central (0) line and heads toward the lower (30) level.
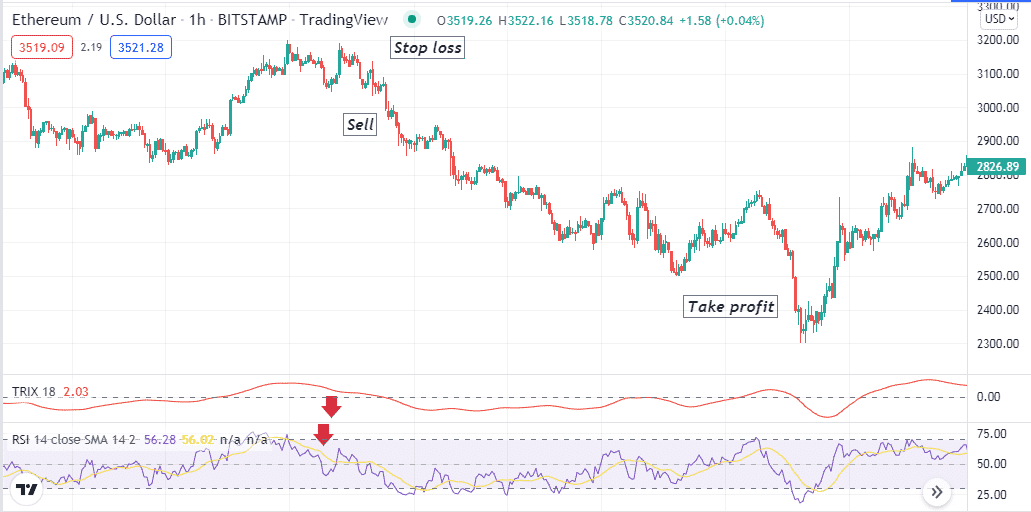
Bearish setup
Entry
Match these conditions above and place a sell order.
Stop loss
Place an initial stop loss above the recent swing high.
Take profit
Continue the sell order until the price remains downtrend or the TRIX indicator reading starts sloping downside toward the central (0) line. Close the sell order when:
- The TRIX indicator starts sloping on the upside.
- The RSI dynamic line reaches below the lower (30) line or starts to rising after reaching that level.
Long-term trading strategy
We use two other popular technical indicators in this trading method:
- Volume indicator
- HMA line of 20-periods alongside the TRIX indicator
This strategy suits fine on many time frame charts; we recommend using a D1 or H4 chart to catch the most potent long-term trades using this trading method. Moreover, keep checking weekly charts and matching the direction before entering the trade for more efficiency.
Bullish trade scenario
Seek to open buy positions when:
- The TRIX dynamic line reaches above the central (0) line and keeps moving upside.
- The price reaches above the HMA line, and the HMA line slops on the upside.
- The volume indicator declares increasing buy volume.
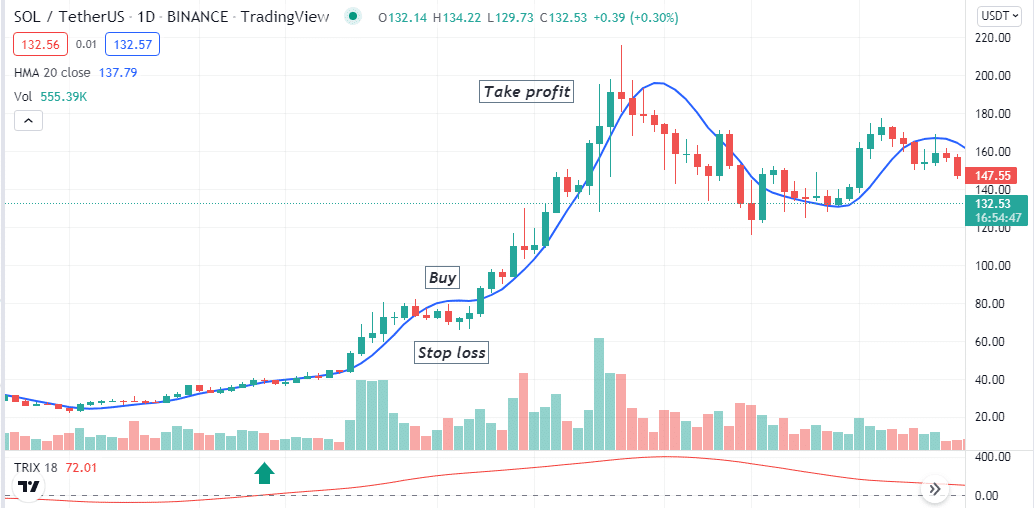
Bullish setup
Entry
When these conditions above match your target asset chart, open a buy position.
Stop loss
Place an initial stop loss below the current bullish momentum.
Take profit
Close the buy order when:
- The TRIX dynamic line starts to slop on the downside.
- The price reaches below the HMA line, and the HMA line starts sloping on the downside.
- The volume indicator declares increasing sell pressure.
Bearish trade scenario
Seek to open sell positions when:
- The TRIX dynamic line reaches below the central (0) line and keeps moving downside.
- The price reaches below the HMA line, and the HMA line slops on the downside.
- The volume indicator declares increasing sell volume.
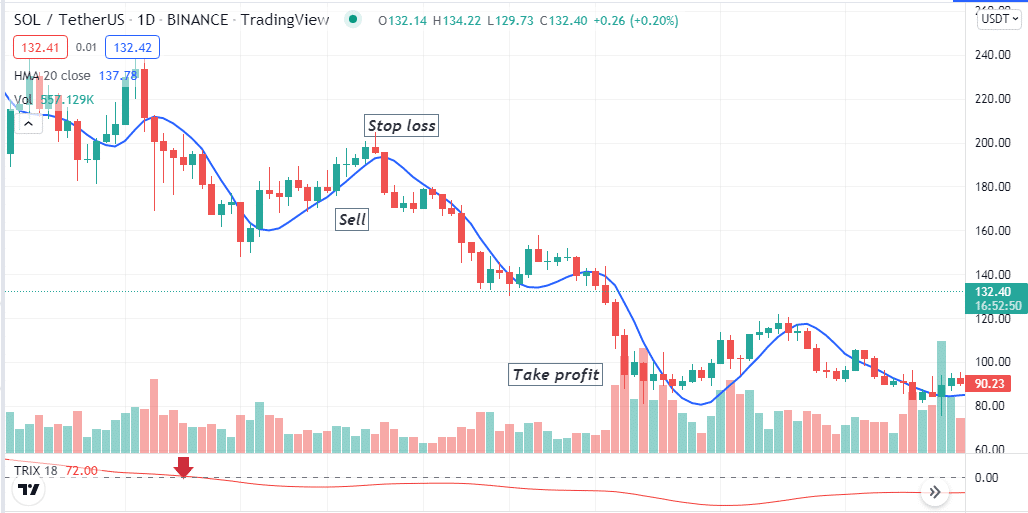
Bearish setup
Entry
When these conditions above match your target asset chart, open a sell position.
Stop loss
Place an initial stop loss above the current bearish momentum.
Take profit
Close the sell order when:
- The TRIX dynamic line starts to slop on the upside.
- The price reaches above the HMA line, and the HMA line starts sloping on the upside.
- The volume indicator declares increasing buy pressure.
Pros and cons
| 👍 Pros | 👎 Cons |
|
|
|
|
|
|
Final thought
The TRIX indicator uses unique calculations to generate trade ideas. So crypto investors often rely on this indicator and create sustainable trading strategies to execute successful trades by combining other technical tools and indicator readings.


Comments