
Wolfe Waves are caused by the forces of supply and demand in all markets and in all time frames. Brian and Bill Wolfe originally discovered them.
These waves form five-wave patterns, where the first four form a wedge and the last one goes beyond that wedge. This latest wave is usually traded. Using Wolfe’s Wave principles, we can calculate the length by drawing a line between point one and point four on the breakout and continuing in the direction of breakout wave five. So this is the profit-taking target line.
Let’s find out how to get the most out of this pattern in forex trading.
What is the Wolfe Wave pattern?
The Wolfe Wave pattern is a five-point structure. In terms of price swings, it consists of four swings. The expected reversal often occurs on the fifth swing. However, the setup is complete when the price reaches point five.
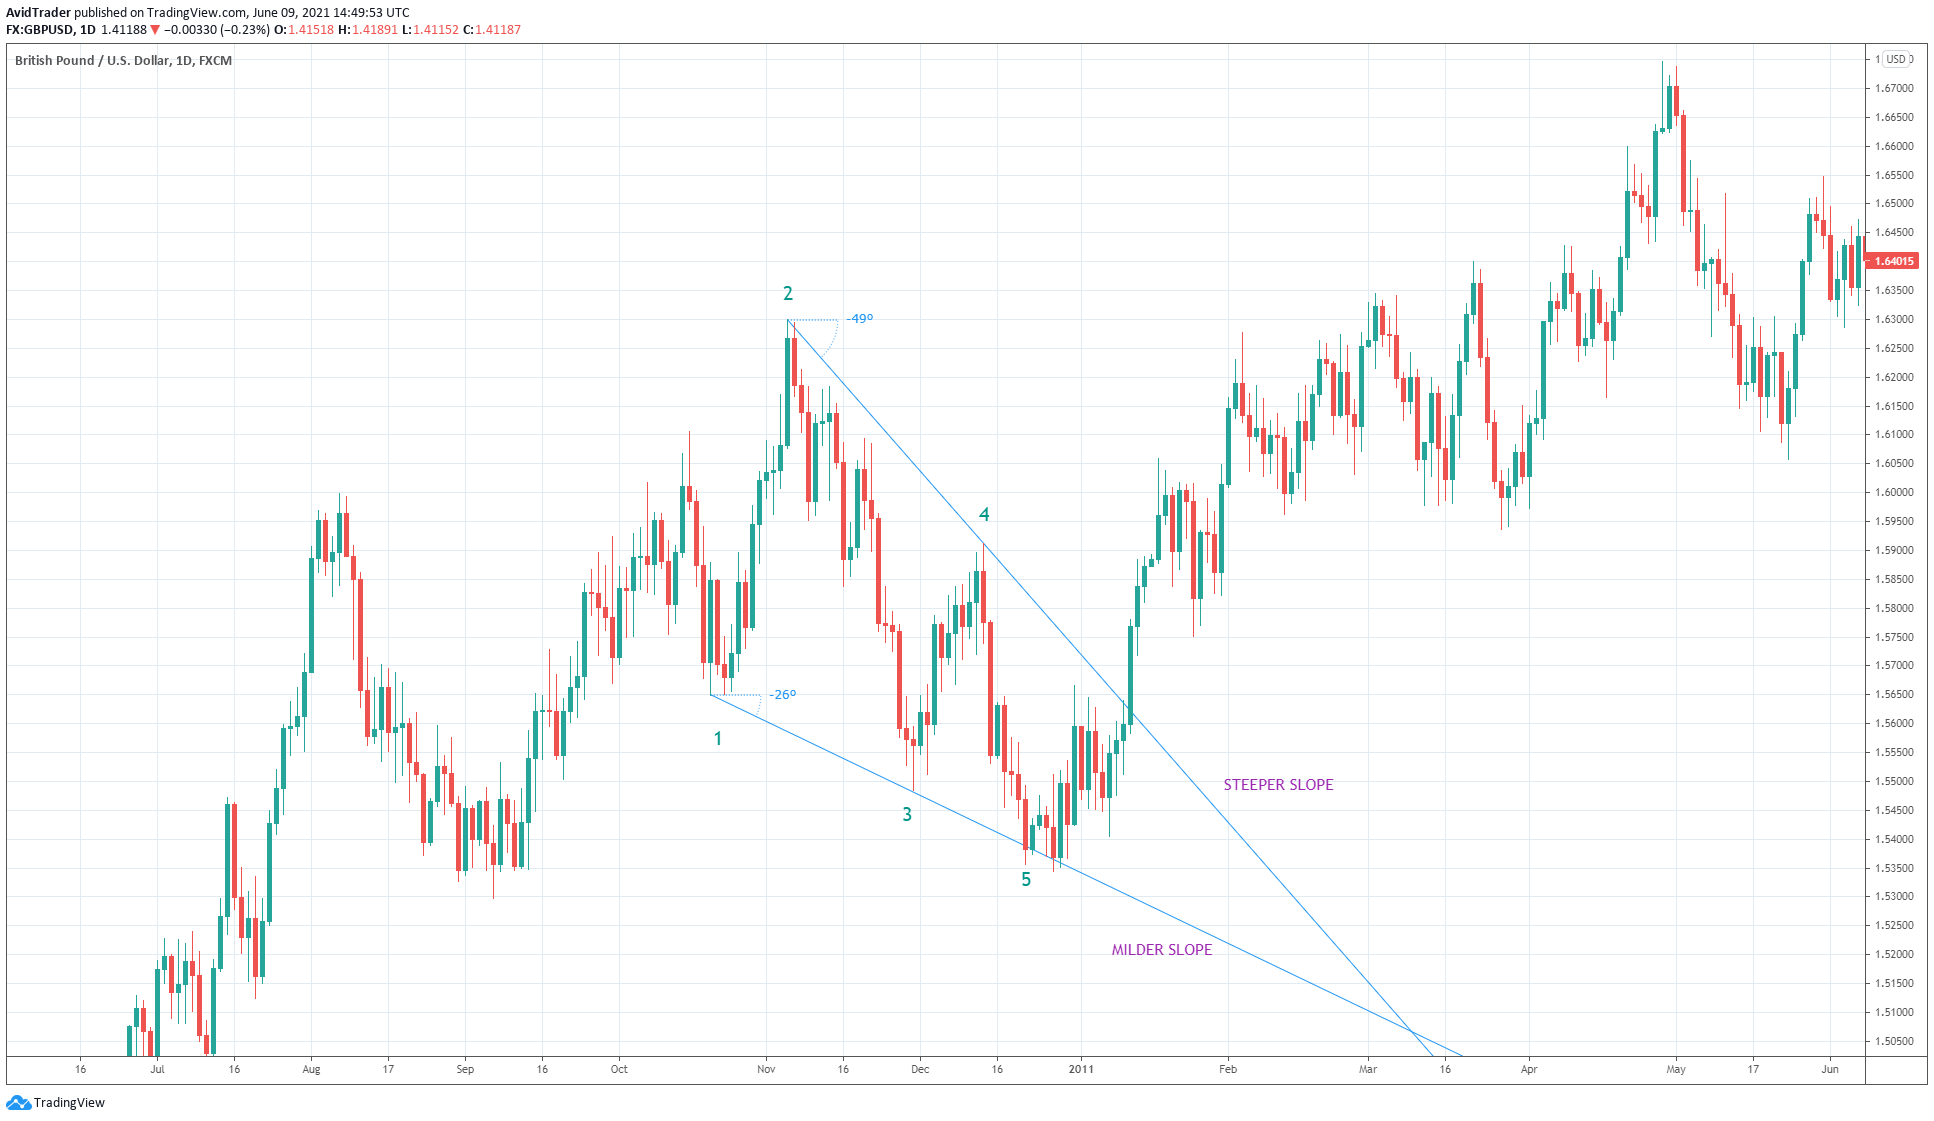
Let’s look at the daily chart of GBP/USD below. So since the pattern formed on the daily chart took more or less two months to complete it. Price setpoint 1st on 20 October 2011 and point 5 on 22 December 2011.
The Wolfe Wave pattern looks like a rising wedge or a falling wedge. We can make the case that the pattern is a subset or particular type of the wedge pattern, so it has a high success rate. It is better than the wedge in this respect.
How to identify the Wolfe Wave?
While it is easy to draw the wedge pattern, the Wolfe Wave pattern is somewhat tricky. This is because of the counting involved in defining the structure. For example, you cannot arbitrarily take any swing high or swing low as point one, which is the most challenging part.
Defining the Wolfe Wave pattern and marking the swings with points on the chart is not that important. What is crucial is the counting process.
Like the wedge pattern, Wolfe Waves have bullish and bearish variants:
- For a bullish Wolfe Wave, you would like point five to hold as support. Then you would look for a buy entry around the point five area.
- For a bearish Wolfe Wave, you would like point five to hold as resistance. Then you would look for a sell entry around the point five area.
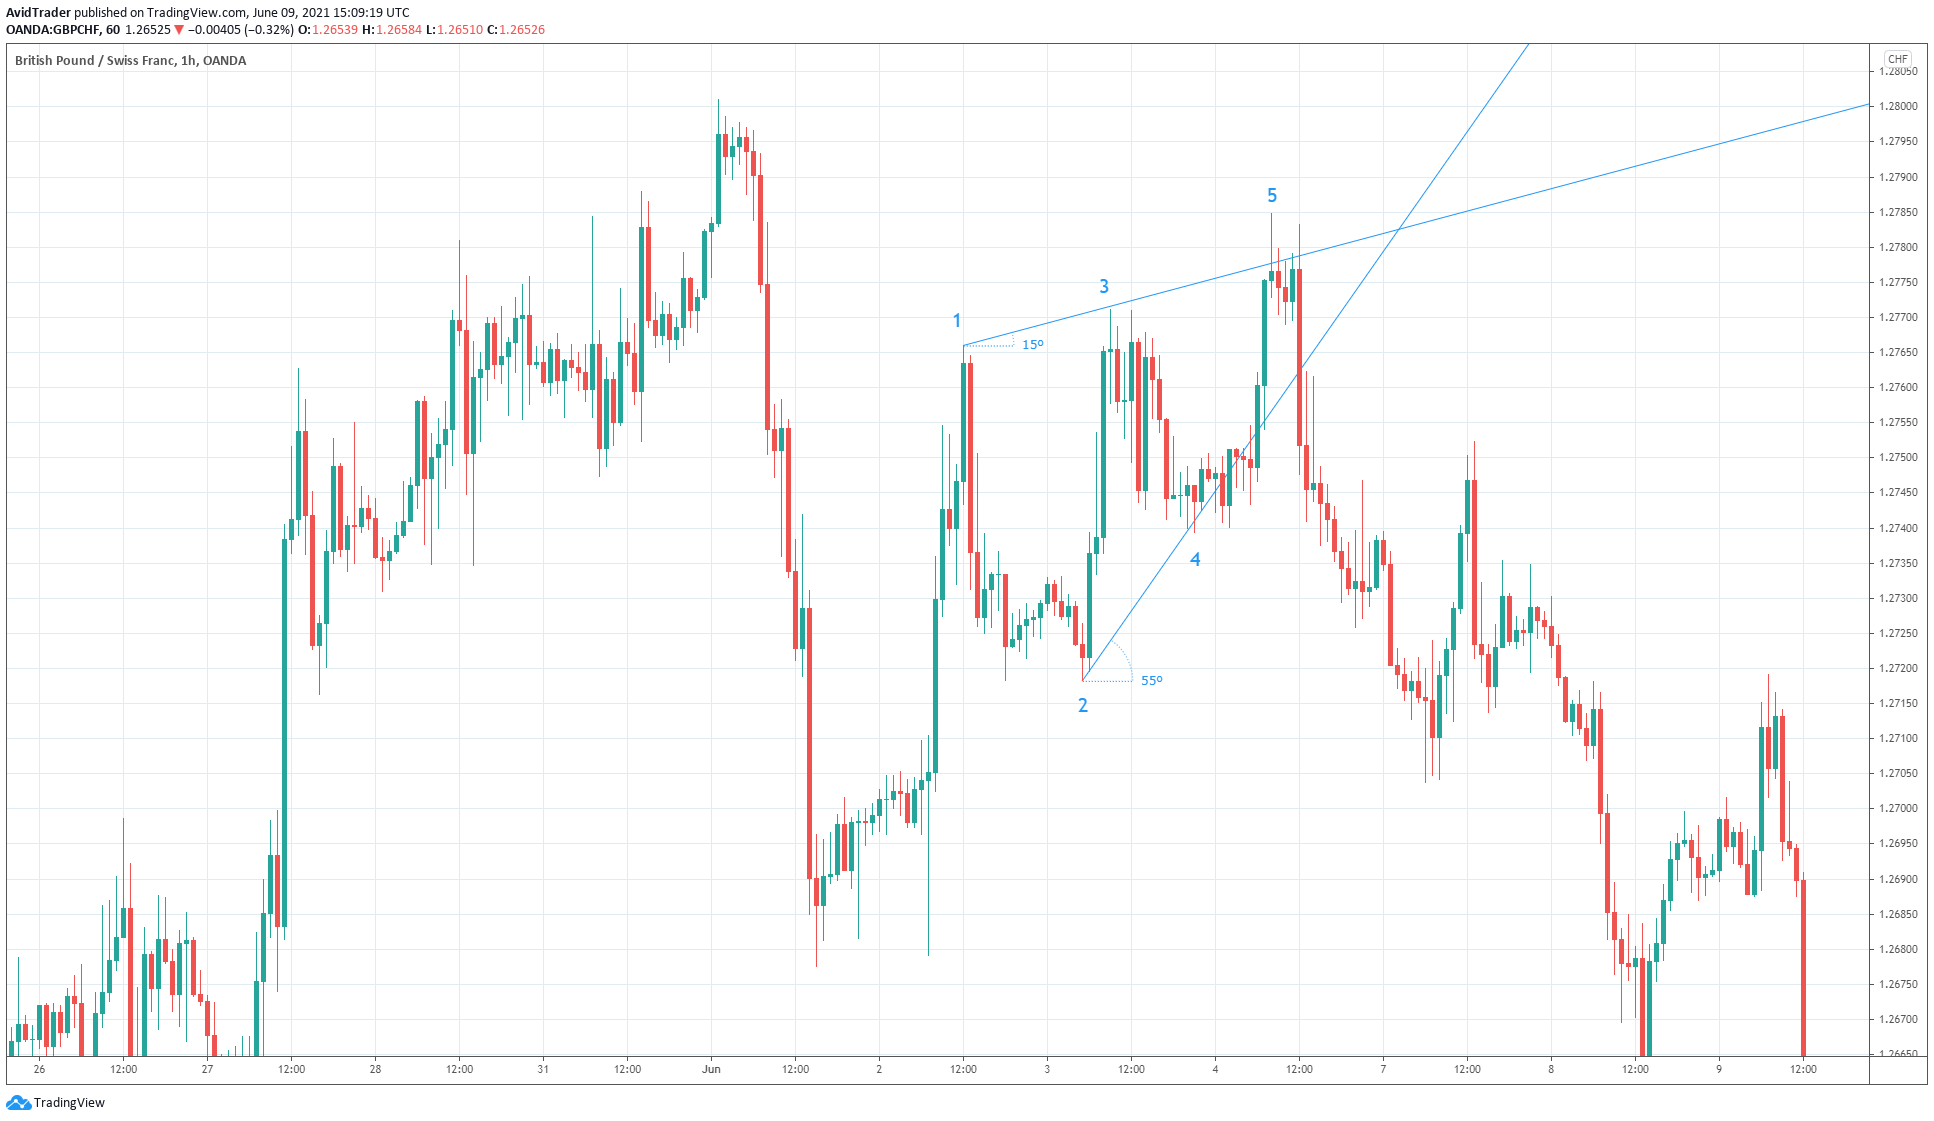
Refer to the above hourly chart of GBP/CHF. This Wolfe Wave pattern is of the bearish variant. The pattern formed from 2 June 2021 to 4 June 2021.
Here is the trick to counting the swings correctly:
- For a bullish setup, point one should be a swing low, not a swing high. Refer to the first chart above.
- For a bearish setup, point one should be a swing high, not a wing low. Refer to the second chart above. Then count from point one to point five, alternately going from swing low to swing high.
How to qualify a Wolfe Wave
Not all Wolfe Wave patterns are equal in terms of appearance and effectiveness. However, they often go together:
- If the structure looks good, the effectiveness is high.
- If the setup is mediocre, the effectiveness is lower.
There are only two factors that qualify a Wolfe Wave pattern, namely:
- The two trend lines must converge.
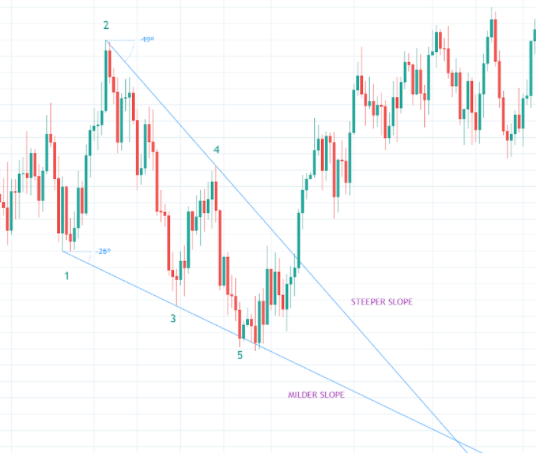
- The trend line in the expected breakout direction should have a steeper angle.
Let us analyze the above charts using these two criteria.
| For the first chart or bullish setup | For the second chart or bearish setup |
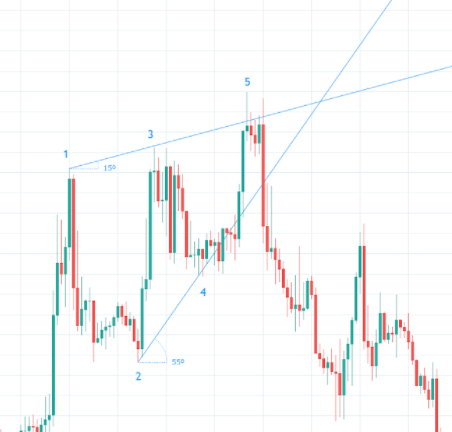
| You can see that the two trend lines intersect on the chart. In addition, the upper trend line is steeper as it has a 49-degree inclination, while the lower trend line is milder in slope (-26 degrees). Therefore, the first chart qualifies as a tradable setup. | The two trend lines intersect. The lower trend line is steeper (55 degrees) than the upper trend line (15 degrees). Hence, the second chart qualifies as well. Once the setup meets the two criteria, you are ready for the next part. |
|
|
Wolf wave trade entry
You can start looking for an entry when the price gets to point five. Unfortunately, there is no single best method you can use to enter the Wolfe Wave trade.
Here are the options available to you:
- Open a trade the moment price touches the trend line extended from point one to point three. Then use an arbitrary number of pips as stop loss.
- Open a trade when the price bounces from point five. Here you can use any candlestick pattern of choice, such as hammer, engulfing, evening star, inside bar, etc. Then you can set your stop loss a few pips below the candlestick formation.
- Open a trade when a one-two-three pattern forms after point five is established.
- Open trade at a lower timeframe near the completion point of the pattern.
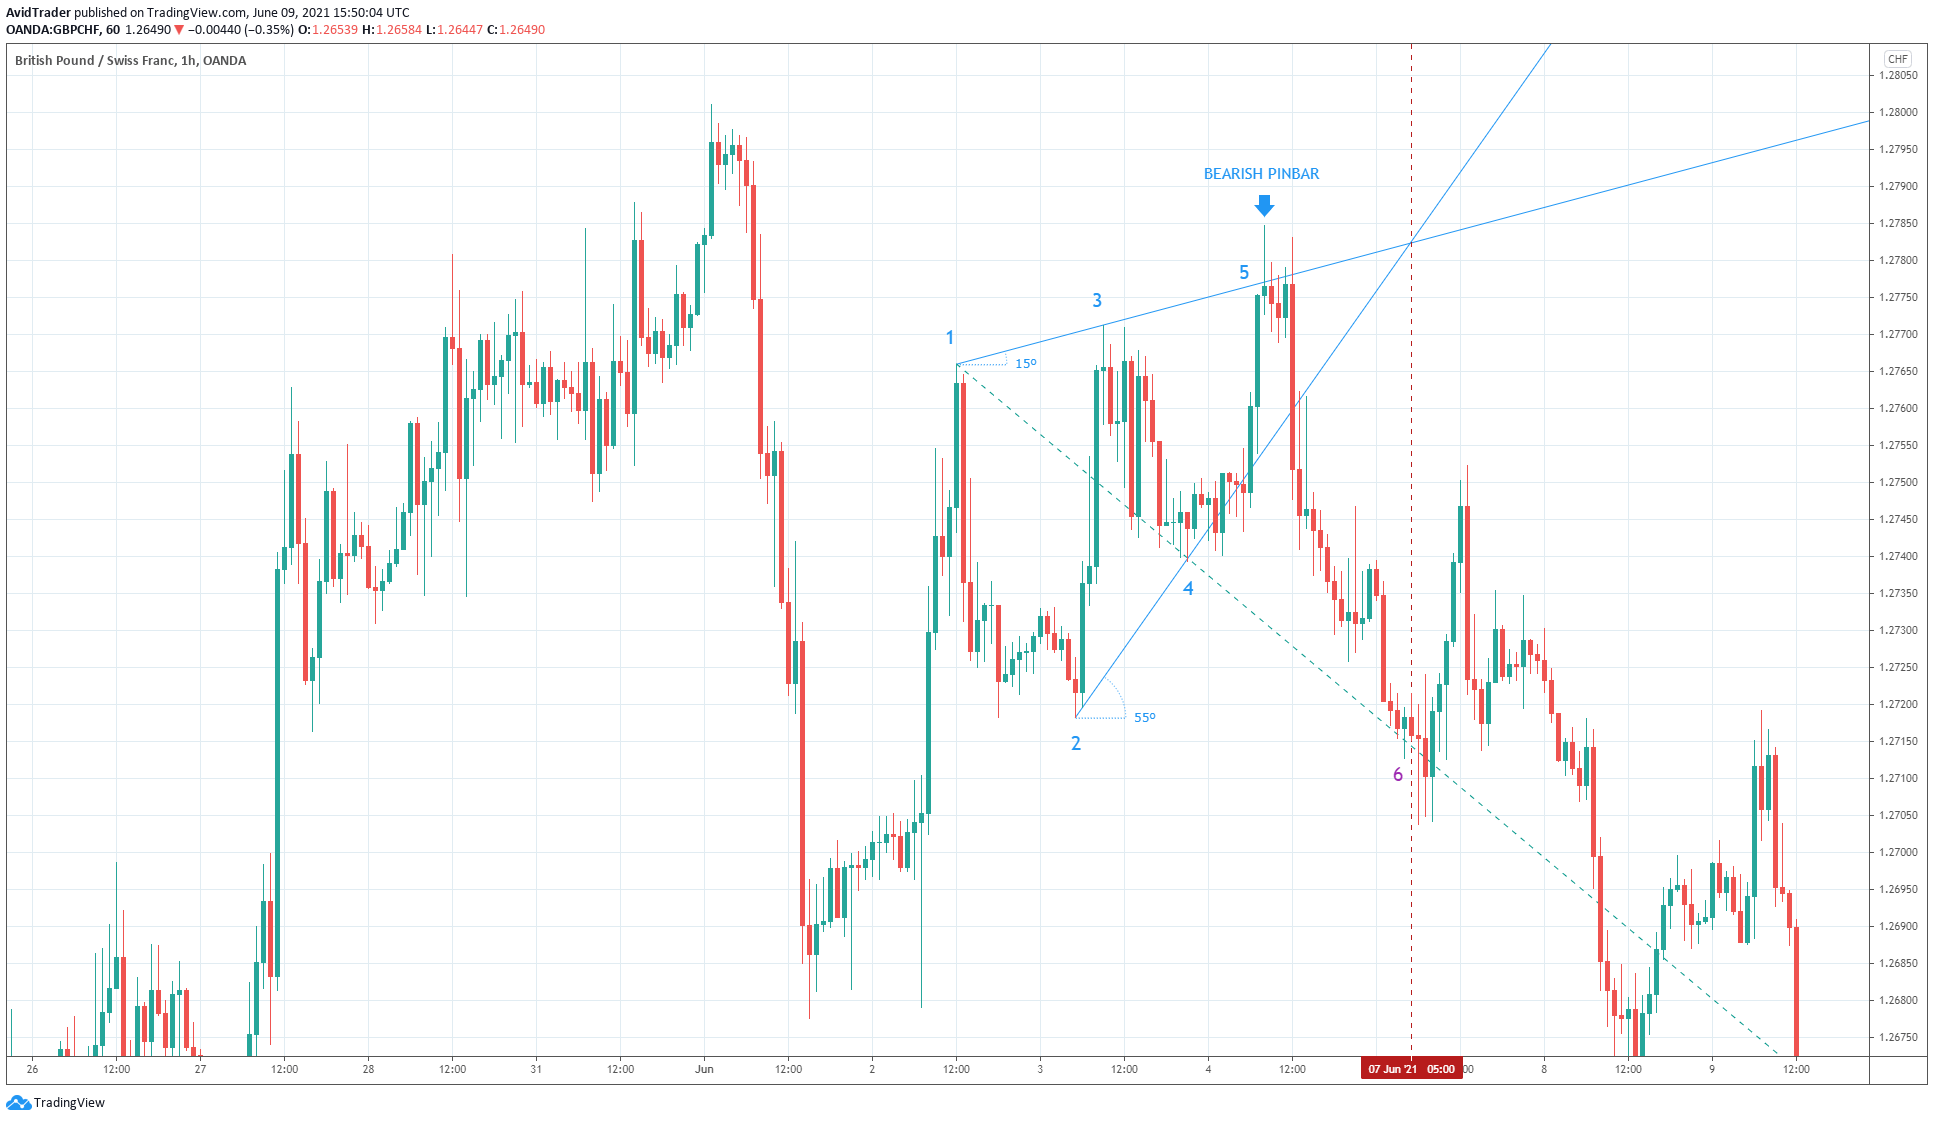
You can enter a sell trade in the above GBP/CHF chart when the bearish pin bar formed around point five. However, this scenario’s best entry strategy as the pin bar also rejected the upper trend line.
Wolfe Wave trade exit
The next question is, “Where would you put your profit target?” Refer to the above chart again.
- The take profit objective depends on the structure of the Wolfe Wave.
- To determine the profit target, connect a trend line from point one to point four and extend the line to the right.
- Next, drop a vertical line from the point where the converging trend lines meet. The intersection of the vertical line and connecting line point one and four is your take profit target.
- The intersection of the trend line and vertical line is marked as point six. It is only the initial target, though. The price may reach this point on time if the volatility is average.
If volatility is low, expect a delay in the estimated time of arrival. At times, the price does not reach its destination at all. Therefore, you need to monitor your trade and be ready to intervene if price dawdles along the way.
Final thoughts
As we have covered in this article, the Wolfe Wave pattern is compelling. In addition, it allows you to make quick profits as price tends to react quickly after touching point five.
A word of caution. The price is not always calm as it moves toward point five. At other times, the price is turbulent. When this happens, you must take a waiting approach. First, wait for volatility to normalize and then enter with your entry strategy.


Comments