
Candlestick trading and understanding some basic patterns are mandatory for all traders. Although this analysis is an ancient approach to analyzing the financial market, it is still an effective way to anticipate the price direction. Harami famous indicates that the existing movement may extend among several effective patterns.
The ultimate success from Harami candlestick trading needs deep knowledge about the market context, trend, and institutional traders’ behavior. You can achieve it by learning a proper trading system using this pattern.
The following section will see the complete guide on Harami, including taking trades in short-term and long-term contexts.
What is Harami candlestick?
It is a form that combines two candles. The unique feature of this technical figure is that it can produce both reversal and continuation of a trend. In Japan, Harami means pregnant, and so its presence in the chart comes with a lower upper and lower shadow in both candlesticks.
Let’s see how this pattern’s structure looks like.
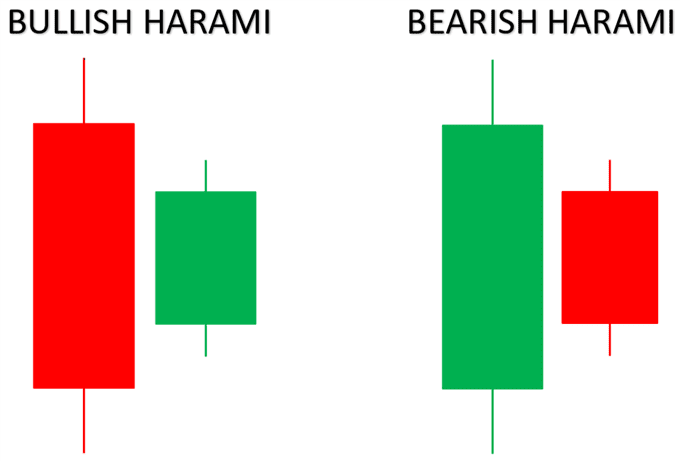
The second candlestick is smaller, which indicates that the opposing party appears in the 2nd candle with less trading activity. Therefore, the inside bar might indicate the continuation of the pattern. However, it depends on how and where the pattern appears.
How to use it?
Let’s see the essential characteristics.
Bullish
- It is a sign of a possible upside pressure in the market.
- A big sell candle comes in this technical figure before the small buy candle.
- There is a gap in the opening and closing position of the 2nd candle.
Bearish
- It is a sign of possible selling pressure in the market.
- A big buy candle comes in this pattern before the small sell candle.
- There is a gap in the opening and closing position of the 2nd candle.
In this pattern continuation, candle 1 has a filled body. Later on, candle 2 closes within the first candle’s body, where there should be a gap in opening and closing price. However, it is often hard to find such gaps in FX trading as the global currency market is 24-hour open, so this technical figure is rarely available in market. Still, if you ignore the opening and closing price of the 2nd candle, you will find it more frequently.
In the trading strategy, the second candle is the confirmation where the more petite body represents the opposite party’s involvement in the market. However, the complete trading entry comes once the price break out from the first candle’s high or low.
A short-term trading strategy
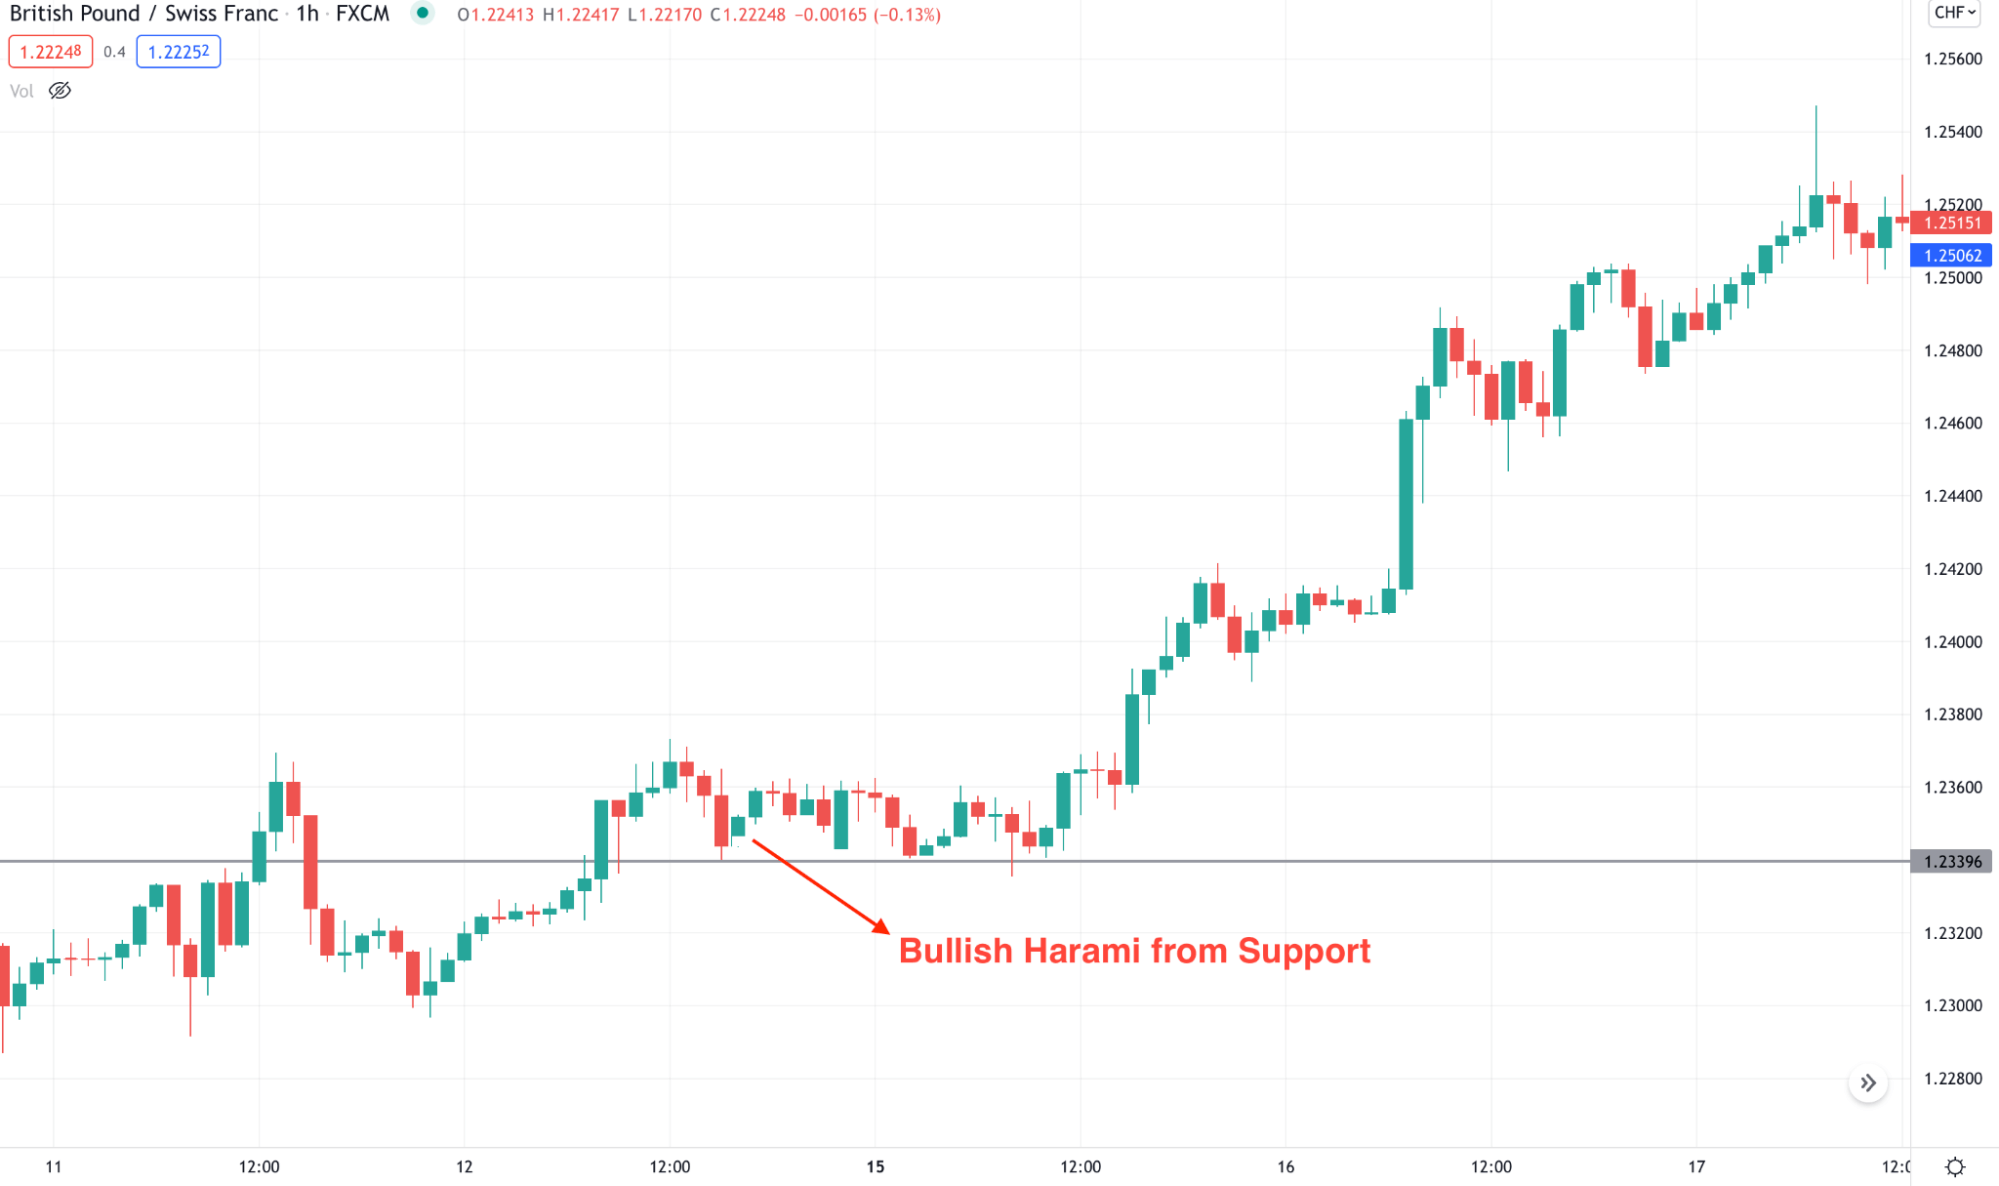
Bullish example
If you can understand the broader market direction, you can easily open a trading position from this technical figure. Make sure that this technical figure follows the broader market context and the pattern appears from an important location.
Best time frames to use
As it is lower-time frame trading, you can use a one minute to one hour chart in your strategy. However, sticking to 15 minutes to one hour has a higher success rate.
Entry
The trading entry is valid once you see the following condition in your chart.
- The broader market direction is bullish. In that case, you can use 50 SMA. If the price is trading above the 50 SMA, consider buying sporadic trades. Similarly, make sure that the price is below the 50 SMA for a sell trade.
- Find the bullish pattern from the support level to buy and the bearish pattern from the resistance level to sell.
- Open the buy/sell position once the 2nd candle closes and the price breaks the first candle’s high/low.
Stop loss
The technical figure becomes valuable once it breaks the first candle’s high/low. Therefore for a sell trade, the SL should be above the first candle’s high, and for a sell trade, it should be below the first candle.
Take profit
As it is an intraday trade, you should book some profit from the primary price swing and hold the trade as long as possible based on the speed of the price.
A long-term trading strategy
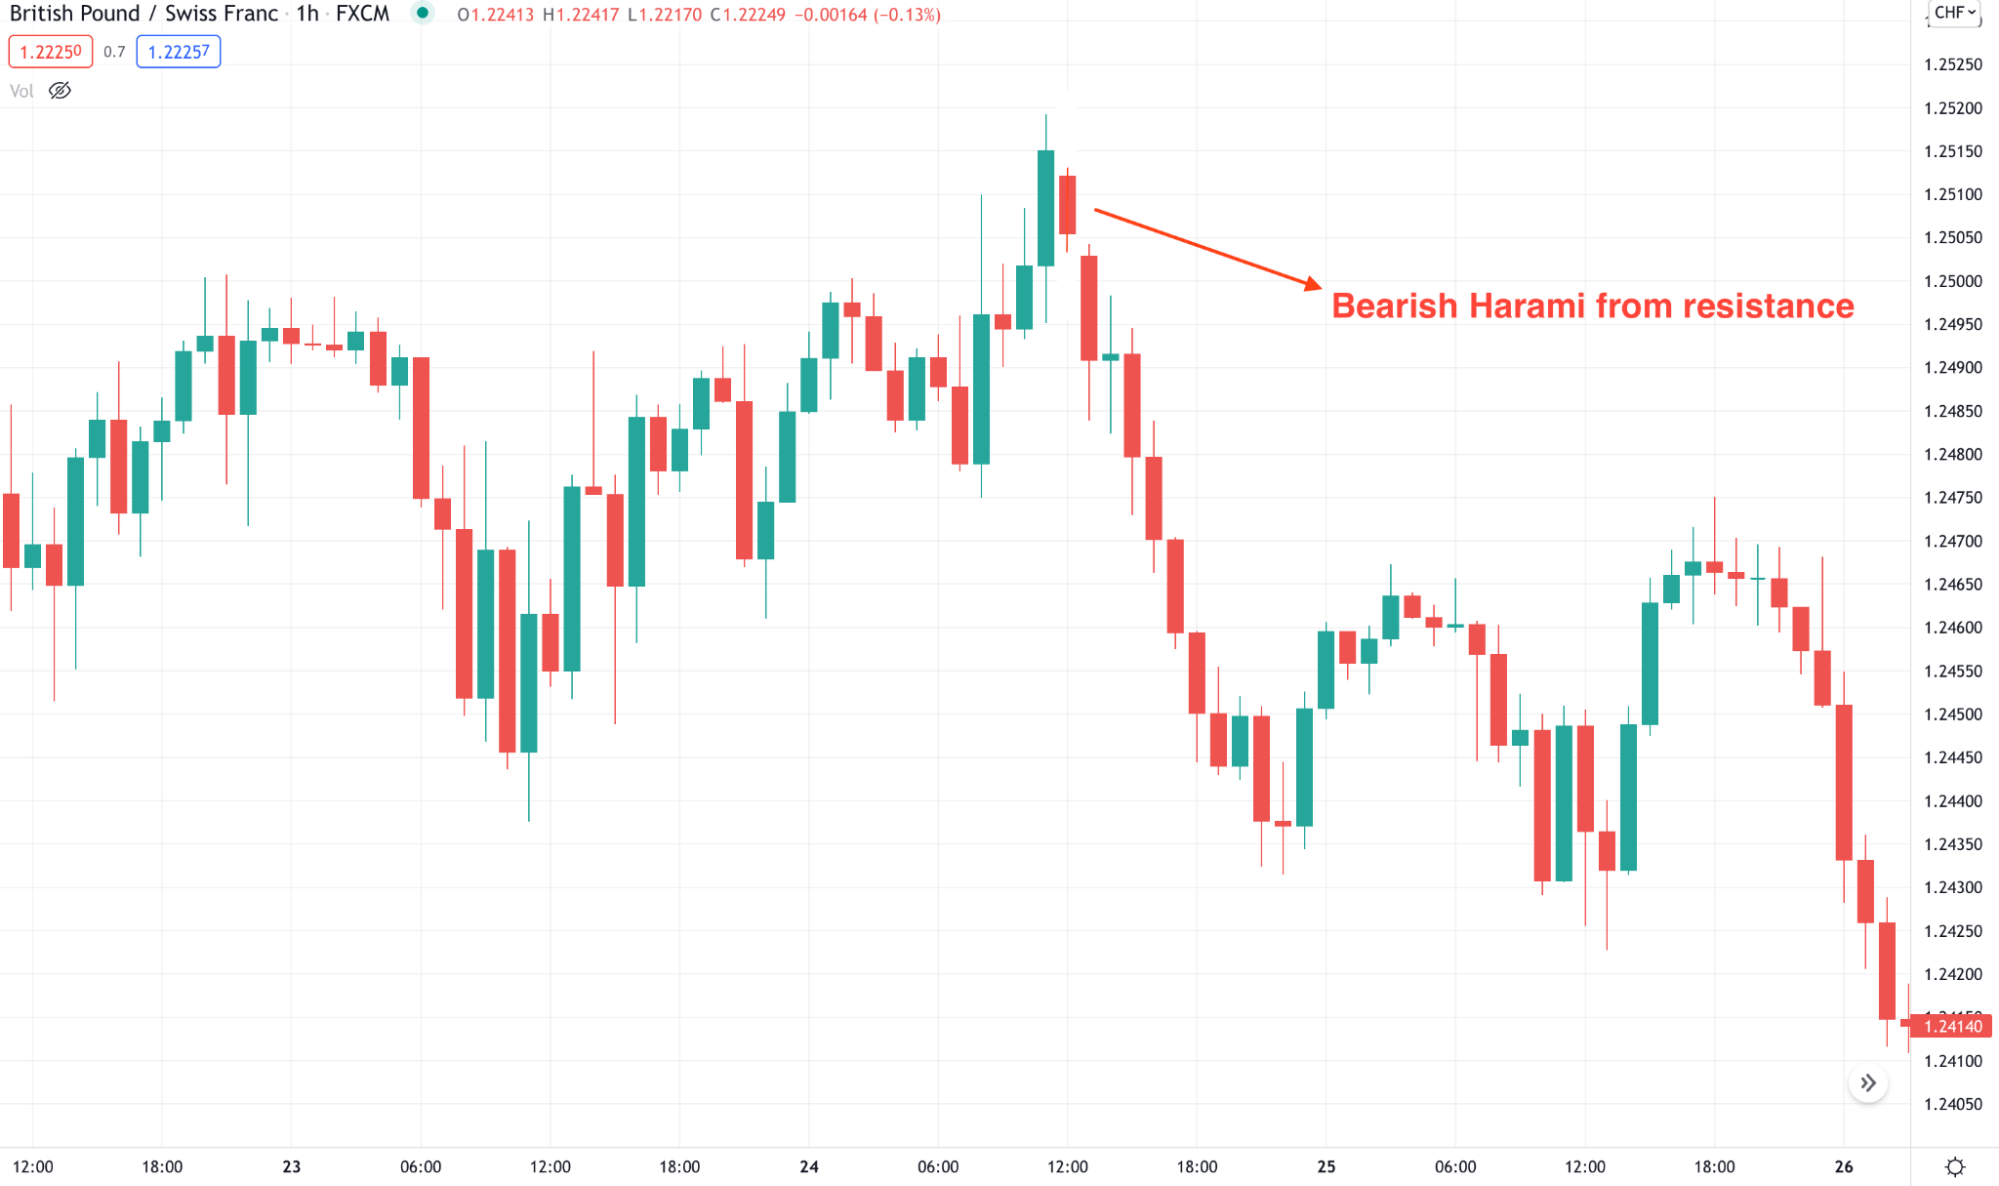
Bearish example
The long-term strategy involves trading towards the broader market direction in higher time frames. Therefore, this strategy is suitable for position and swing trading. Besides, it perfectly matches the price action analysis.
This method will get the market direction from trend and price action. Later on, we will open the buy or sell position using the technical figure.
Best time frames to use
As it is a higher time frame trading, you can stick to time frames from H4 to 1 week.
Entry
The trading entry is valid once you see the following condition in your chart:
- Identify the market direction from observing the trend.
- Find the bullish pattern from the support level to buy and the bearish pattern from the resistance level to sell.
- Open the buy/sell position once the 2nd candle closes, and the price breaks the first candle’s high/low.
Stop loss
For a sell trade, the SL should be above the first candle’s high, and for a sell trade, it should be below the first candle.
Take profit
Set it based on the near-term support or resistance level. Besides, if the market pressure is good, you can hold the trade for an extensive period.
Pros and cons
| 👍 Pros | 👎 Cons |
|
|
|
|
|
|
Final thoughts
In the final section, we can say that this technical figure is very effective if combined with the price action and market trend. Besides, there are some unavoidable risks in the FX. Therefore, use appropriate trade management to get the maximum benefit.


Comments