Both technical and fundamental analysis is the primary weapon for traders to open a position and settle smart trading choices. For example, trading in the forex market is an intelligent way to earn money that requires a lot of understanding, calculation, and trading analysis.
Before buying or selling a currency pair, traders should gather essential market data, price action, previous history of the price, and other information. The one way is to pick economic releases and make trading decisions based on this. On the other hand, another way is to see the graphical representation of the price and take trading decisions from it.
Which one is the best?
In the following section, we will make a detailed comparison between two types of analysis that you should know before starting to trade.
What is technical analysis?
It utilizes market data, basically previous values, and volumes to anticipate the future price. Many successful traders use this method to estimate the possible market movement based on the past performance of the price.
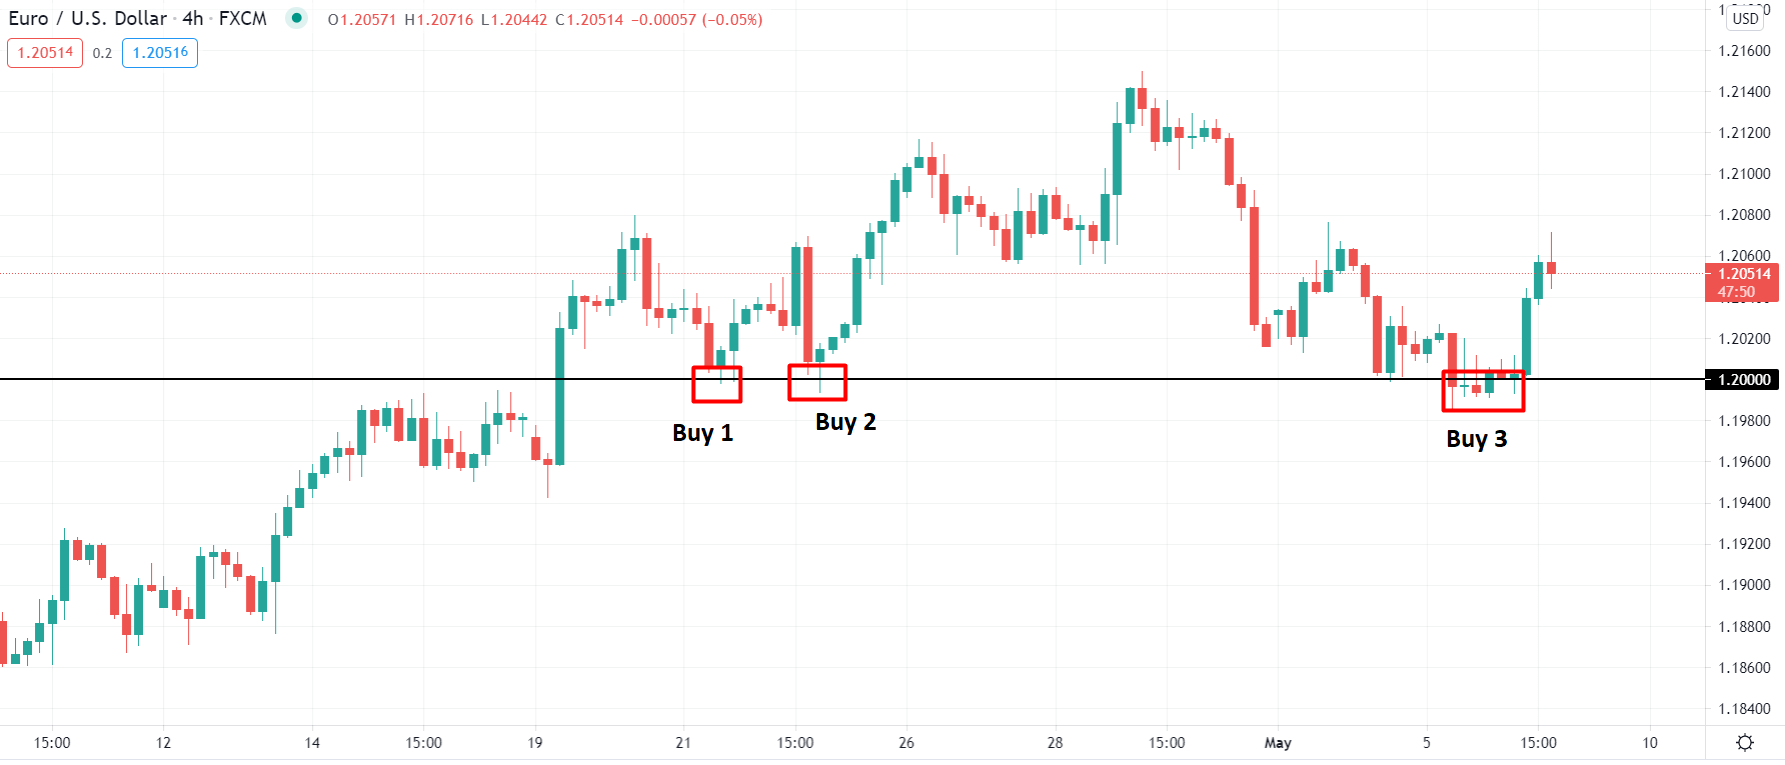
Let’s have a look at a visual representation of how technical analysis works in the financial market:
Here we can see the daily chart of EUR/USD where a horizontal level is marked at 1.20 level. You can see how the price came to this level and moved higher. It is a clear indication that buyers are interested in buying EUR/USD at this level, and you can also take part in it by just observing the chart.
Besides the simple example, traders often use indicators, tools, candlestick patterns, price patterns, and expert advisors as technical analysis material to make trading more meaningful. However, the best benefit of this type of analysis is that it does not require any finance graduate or economist qualification. In contrast, fundamental analysis requires substantial knowledge about the global economy.
What is fundamental analysis?
It is the way to evaluate economic, financial, and political data and anticipate the price movement based on this. In addition, central banks directly influence the forex market, where any decision may change the currency value.
For example, the interest rate is the most significant fundamental event that influences the forex market. When the economy becomes more robust, central banks try to devalue the currency by increasing the interest rate. As a result, currency value increases. On the other hand, the currency value may decline with the decrease in the interest rate. Moreover, many other facts also work as important fundamental indicators.
The central fact about fundamental analysis is that traders should have explicit knowledge about entire essential events. Therefore, any traders with a strong background in finance or economics may understand fundamental analysis well.
Tools used for fundamental and technical analysis
Fundamental analysts think about a country’s monetary policy, inflation data, gross domestic products, etc. On the other hand, technical analysis requires a vital education about strategy and tools.
Top economic news includes:
- Publication of interest rates of central banks
- GDP data output
- Speeches by the heads of the Central Banks
- Data on unemployment in the US (non-farm payrolls) – one of the big news, published on the first Friday of each calendar month. This indicator can have a severe impact on the movement of currency pairs.
- Retail sales- providing the number of sales that happen at the retail level.
In addition, there is other news that individuals are not of great importance, but in combination can have a noticeable impact on the market.
Political news includes:
- Election of presidents
- Parliamentary elections or dissolution of parliaments
- Changes in governments, resignations, and appointments
- Force majeure circumstances
- Natural disasters and natural disasters
- Wars, terrorist attacks, strikes, etc.
The use of fundamental analysis in trading is to predict medium and long-term movements in the market, based on the news background. For example, for quick earnings, traders use the moment of a news release. At this time, a considerable rise or fall in the quotes of trading instruments can occur on the market, which, with a competent approach, can give a good profit.
Now move to some essential tools for technical analysis:
- Technical Indicators: moving average, RSI, MACD, stochastic, etc.
- Trading tools: horizontal lines, Fibonacci, Gann, etc.
- Candlesticks
- Price action with market context
- Elliott wave
- Supply and demand
However, there is no way how many trading tools a technical trader should know as it depends on the style of dealing. But, every trader should know the uses of some fundamental indicators and trading tools.
Fundamental vs. technical analysis: which is better?
The discussion over technical and fundamental analysis is argumentative. In fundamental analysis, traders can say the exact reason behind the movement of a currency pair. However, even if all essential data is robust, currency’s value may reduce, known as fundamental divergence. Therefore, the fundamental analysis does not provide a 100% guarantee of the price movement.
On the other hand, technical analysis is a way to calculate the probabilities of the upcoming price movement. If multiple tools provide the exact price direction, the market is likely to follow the path. But, like the fundamental analysis, the technical one does not offer a 100% guarantee of a price movement.
Therefore, there is no exact way to say which method is more effective; it depends on the trader’s observation of the market. If a trader can make a regular profit with the technical analysis, it is outstanding. On the other hand, institutional traders spend millions of dollars on hiring fundamental analysts.
How to use the fundamental & technical analysis together?
There are a few ways of using fundamental and technical analysis together. Using the fundamental analysis, you can make a list of currency pairs that potentially cause the price movement. Later on, to settle on whether you want to trade or not, use technical analysis. Also, you can combine a breakout strategy with fundamental research.
What is the breakout strategy?
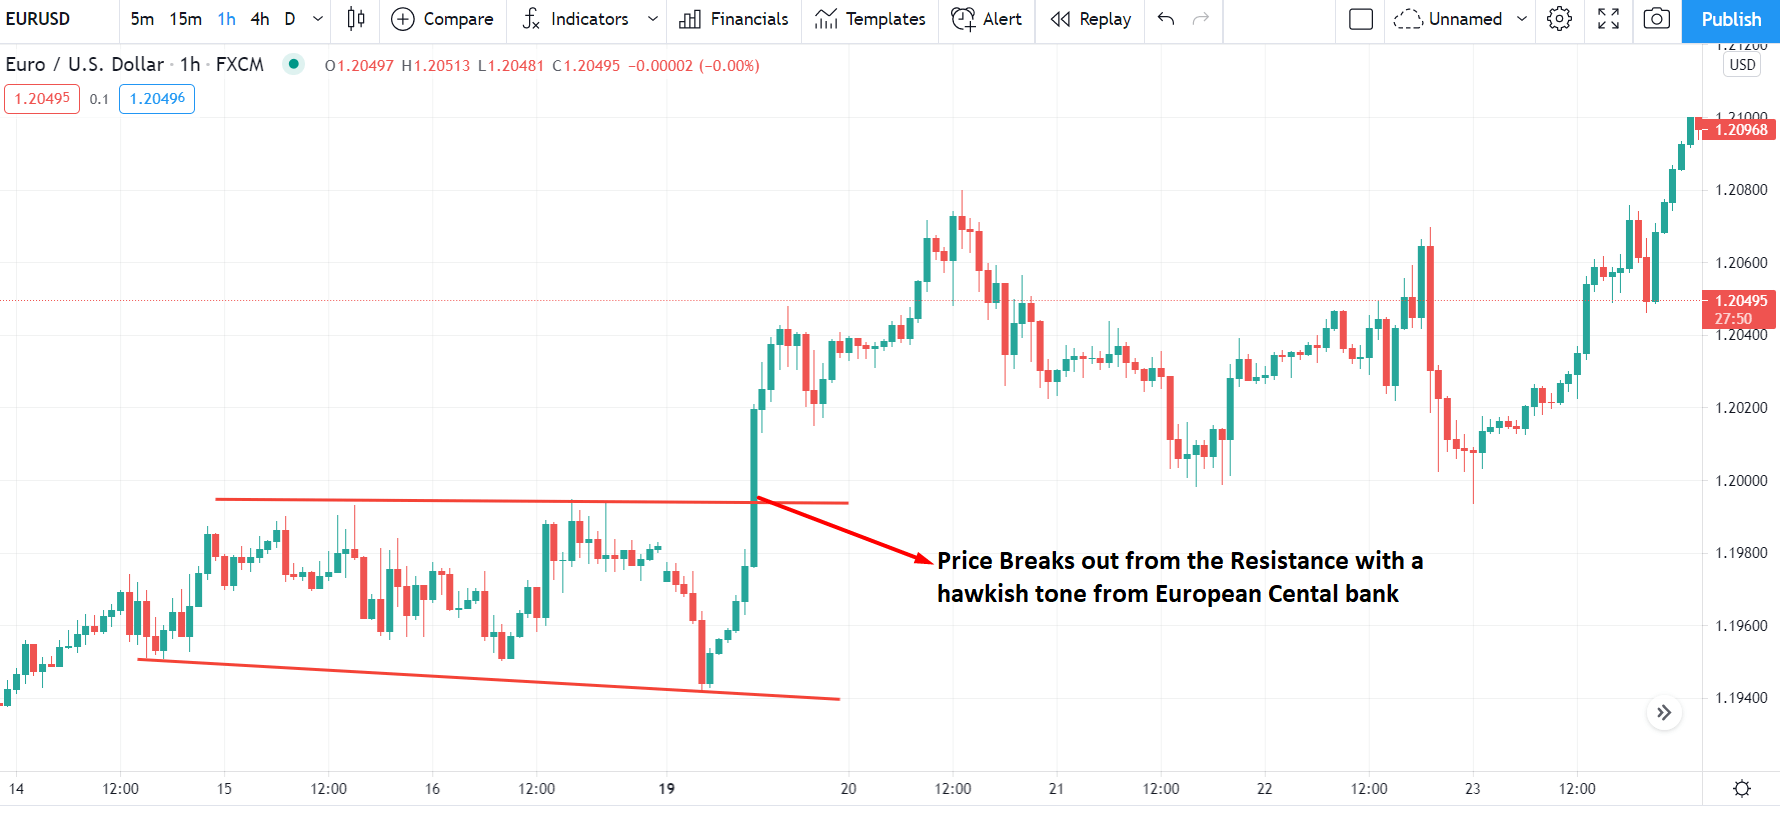
It is a method to open a position as soon as the price moves beyond the price range with a tremendous speed. Moreover, traders can include significant horizontal and dynamic support/resistance levels with multiple technical confirmations to take a trader towards the fundamental direction.
For example, if the European Central Bank raises the interest rate, EUR/USD may move higher. In that case, traders should wait for the price to break above any significant resistance level. Once the price becomes stable above the resistance level, traders can open a buy position.
Final thought
Technical analysis is an enlightening method to oversee the market direction, yet note that fundamental analysis plays a vital role. Based on the above discussion, you choose whether you want to be a technical trader or the fundamental trader. Some of the traders can mix these analyses to make trading more meaningful.
Lastly, whether you are a technical or fundamental trader, you should build a trading strategy with appropriate trader management rules.


Comments