The Puell Multiple is a popular crypto indicator applicable in evaluating the mining pools’ current amount of profit in contrast to the one-year historical average. The estimation of the metric comes from considering the daily value and the 365-day moving average of a particular coin. It supports traders to measure the market cycles from a global viewpoint.
The future price of a cryptocurrency mostly depends on how the mining of the token is happening. The change in supply-demand from mining affects the price and allows investors to benefit. Therefore, including this crypto indicator in your trading checklist would increase profitability to a satisfactory level. Let’s see what the Puell Multiple indicators look like and how they make money with them.
What is Puell Multiple?
It measures the basics of mining profitability and the mechanism of shaping the market cycles. It is estimated by using a ratio of the daily issued coins (in USD) and the 365 moving average of it.
Typically, the deciphering of the Puell Multiple is possible to take into account the following structure:
- High values advise on the current profitability of mining, whether it is high relative to the yearly average. In essence, the incentives are massive in liquidating miners’ revenues. Also, significant pressure on sales is potentially anticipated.
- Low values specify if the current profitability of mining is low in contrast to the yearly average. In essence, there is an existing income factor; hence, numerous miners may require switching off rigs to minimize hash power. It raises the hash-share of the rest of the miners, able to sell fewer coins to support their functioning, lowering their effect on liquid supply.
- Halving events will reduce the current coin dispensation by 50% compared to the previous year, developing an instant halving of the Puell Multiple. The impact on miner profitability will be according to the point mentioned above of low values.
How to trade using Puell Multiple indicators in crypto strategy?
The rising of the Puell multiple means that the price=revenue of miners is significantly escalating than the cost they put in. In this case, crypto glided to the point that Miner’s revenue exceeded their cost. Estimating the true value of the crypto and miners’ cost and hash rate may suggest the crypto price is sky-high. It may imply that the price is overrated and shooting up miners’ grounds to sell.
On the other hand, in case Puell multiple declines, it manifests that the price=revenue of the miners is significantly declining in contrast to their submitted costing. At this point, crypto price dips take the miners beyond managing the electricity cost, leading some miners to stop their mining activity. In other words, it could specify that the price is underrated, which increases miners’ intention for holding their crypto reserve.
A short-term trading strategy
This method will add the Puell multiple indicators for understanding the upcoming market momentum in the lower time frames. You can apply this strategy to the M5 and the M15 time frames.
Bullish trade scenario

Short-term bullish trade scenario
Entry
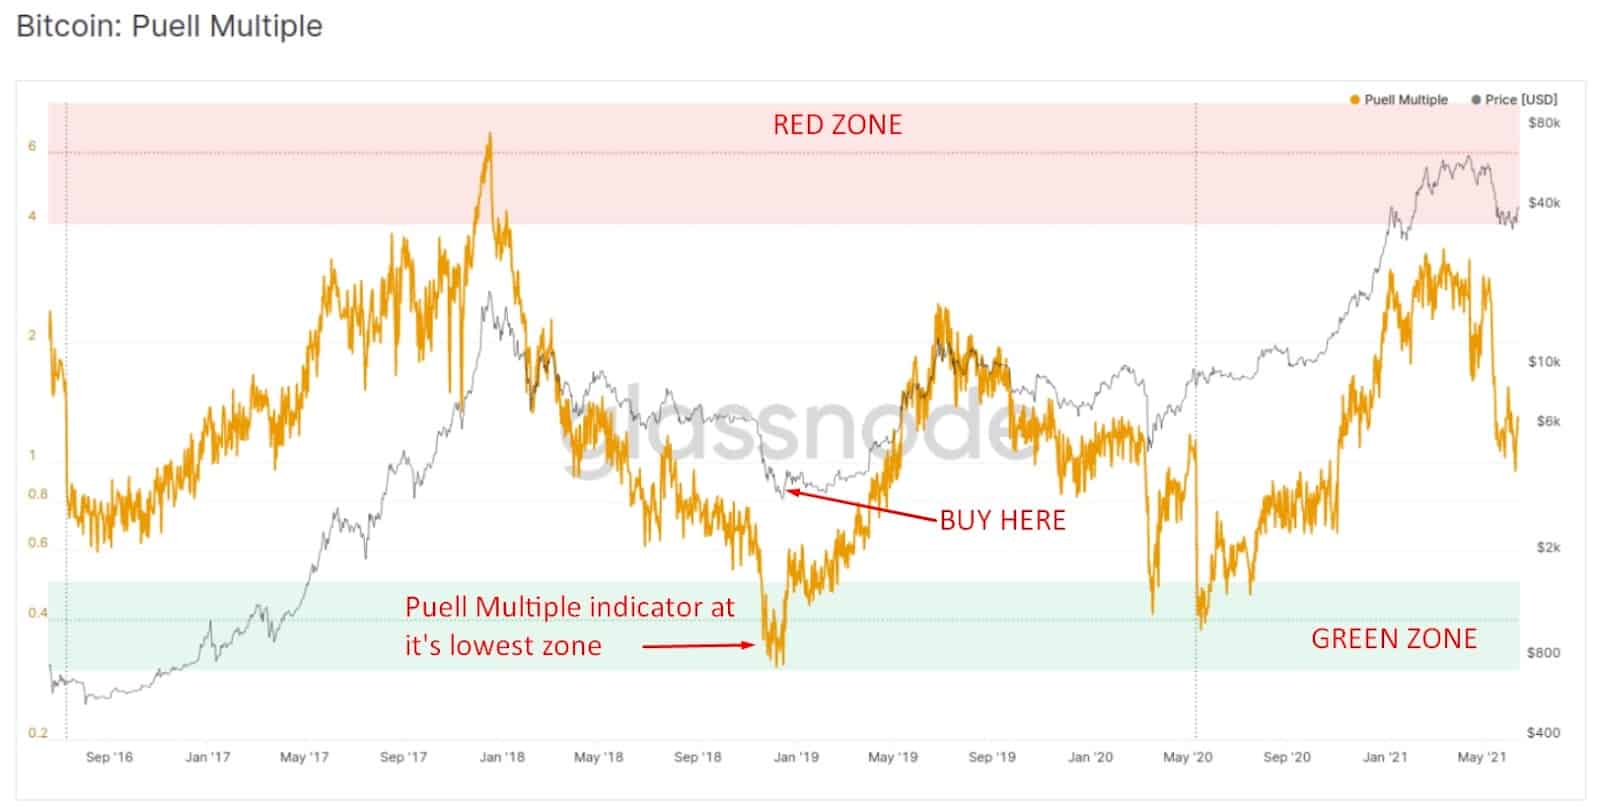
Look for a buy entry when the Puell multiple indicator line resides at the green zone, and the price is above the Puell multiple lines, indicating an upcoming buy pressure.
Stop-loss
Put the stop loss order below the last swing level with at least a 5-10 pips buffer.
Take profit
Take the profit by calculating at least a 1:3 risk/reward ratio. Otherwise, you can take the profit when the Puell multiple lines reach the red zone.
Bearish trade scenario

Short-term bearish trade scenario
Entry
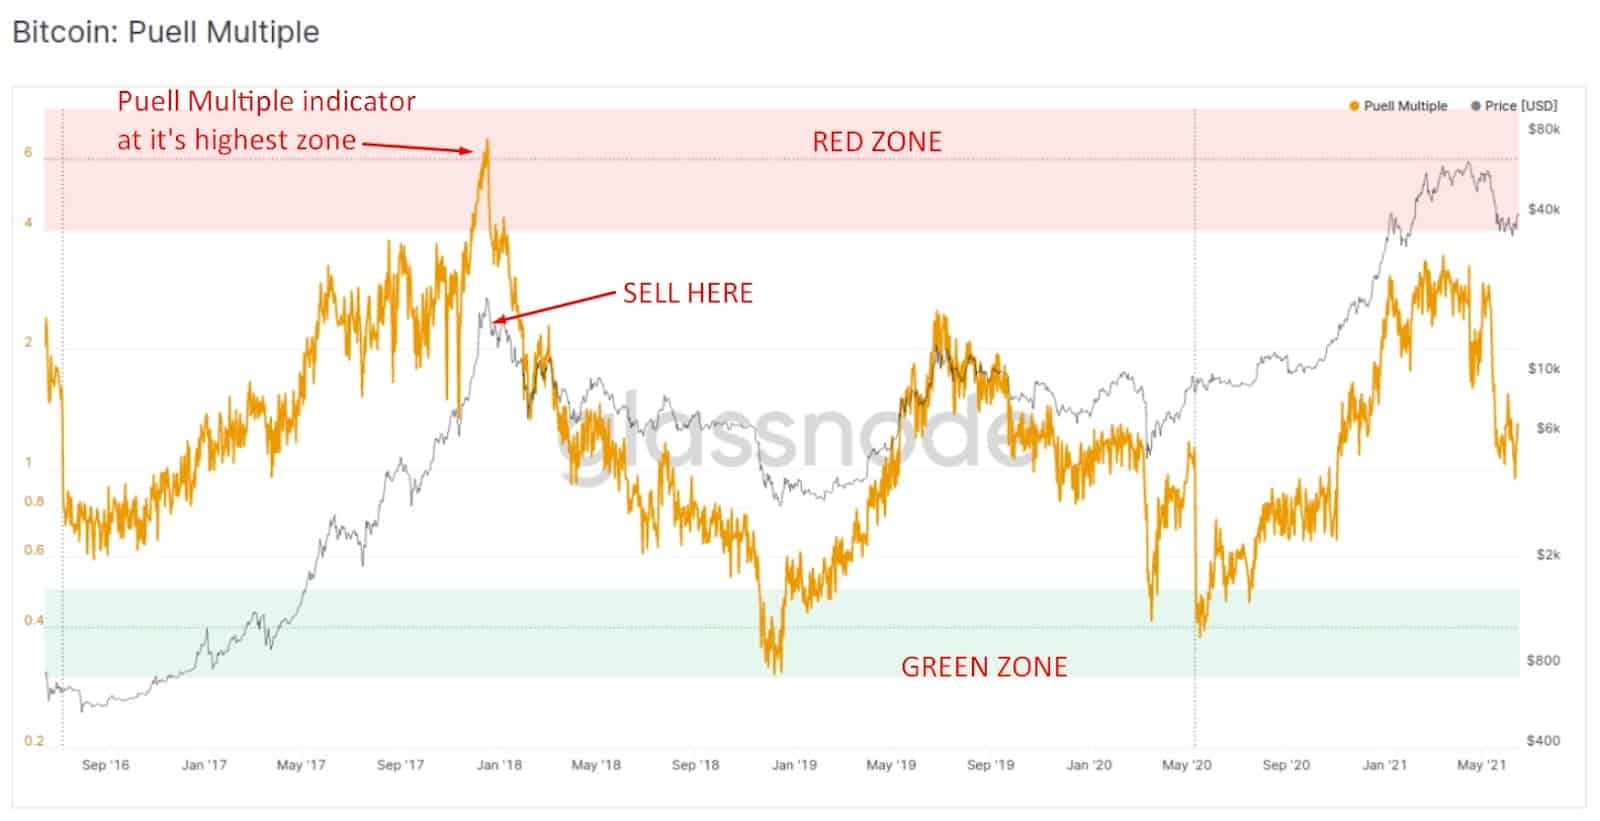
Look for a sell entry when the indicator line resides at the red zone, and the price is below the Puell multiple lines, indicating an upcoming sell pressure.
Stop-loss
Put the stop loss order above the last swing level with at least a 5-10 pips buffer.
Take profit
Take the profit by calculating at least a 1:3 risk/reward ratio. Otherwise, you can take the profit when the Puell multiple lines reach the green zone.
A long-term trading strategy
In this method, we will add the Puell for understanding the upcoming market momentum in the higher time frames. You can apply this strategy to the H4 and the D1 time frames.
Bullish trade scenario

Long-term bullish trade scenario
Entry
Look for a buy entry when the indicator line resides at the green zone and the price is above the Puell multiple lines, indicating an upcoming buy pressure.
Stop-loss
Put the stop loss order below the last swing level with at least a 5-10 pips buffer.
Take profit
Take the profit by calculating at least a 1:3 risk/reward ratio. Otherwise, you can take the profit when the Puell multiple lines reach the red zone.
Bearish trade scenario

Long-term bearish trade scenario
Entry
Look for a sell entry when the indicator line resides at the red zone and the price is below the Puell multiple lines, indicating an upcoming sell pressure.
Stop-loss
Put the stop loss order above the last swing level with at least a 5-10 pips buffer.
Take profit
Take the profit by calculating at least a 1:3 risk/reward ratio. Otherwise, you can take the profit when the Puell multiple lines reach the green zone.
Pros & cons
| 👍 Pros | 👎 Cons |
|
|
|
|
|
|
Final thoughts
The tool is appreciable at pointing out the buying and selling points from a long-term approach. If you consider going for the ‘hold on for dear life’ crypto, then the Puell indicators are a must-have in your magazine for shooting the feasible macro entry and exit points.


Comments