Professional financial traders use many chart types to determine potentially profitable trading positions. While most traders commonly use candlestick charts or bar charts, professional traders use many other types, including Three Line Break, the Kegi, point, and figure, Renko, etc.
However, while seeking to trade using chart patterns or indicators, it is mandatory to have a basic understanding of the concept alongside learning professionals’ way. This article will introduce you to the Renko indicator and its successful crypto strategies.
What is the Renko indicator?
Renko charts are usually patterns similar to boxes and have no upper or lower shadows. The name Renko comes from the Japanese “Renga,” which means bricks, as the chart contains a series of bricks of different colors. The series of green bricks indicates bullish price pressure or an uptrend market movement, and the red bricks series represents a downward price movement.
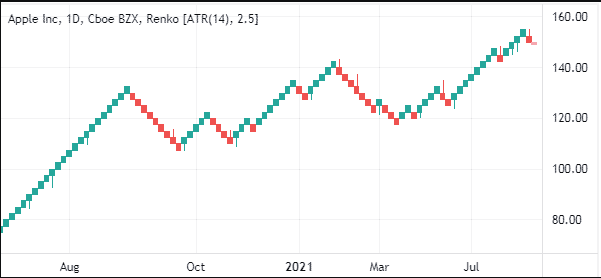
Renko chart
Renko focuses on price change and ignores time factors. It filters market noise; the box size is bigger for significant movement, and the box will be smaller for little price change. So it becomes easier to determine the trends.
How to trade using the Renko indicator?
The Renko indicator is easy to use. You can use this indicator independently or combine the reading with other indicators to determine the trading positions. For example, you can use parabolic SAR to determine the swing points.
When the parabolic SAR dot takes place below price candles and green bricks appear, it declares an uptrend. Meanwhile, the parabolic SAR dot switches on the upside, and red bricks declare a downtrend. This indicator generates good trade ideas on many time frame charts. Again, Ichimoku cloud focuses on the time factor, and Renko focuses on price change. So combining these two can help you to create invincible trading strategies. Meanwhile, hourly or 4H charts are preferable.
Short-term trading strategy
We use the Ichimoku cloud alongside the Renko indicator in this trading method. Combining both indicators, it becomes easier to determine trading positions. We recommend using this method on an hourly chart when seeking short-term trading positions.
Bullish trade scenario
Apply both indicators at your target asset chart and seek to open buy positions when:
- The Tenkan-sen is above the Kijun-sen.
- Chikou Span line is above price candles.
- Price candles are above the cloud (green or red).
- Renko green bricks appear and start making a series 45-degree angle on the upside.
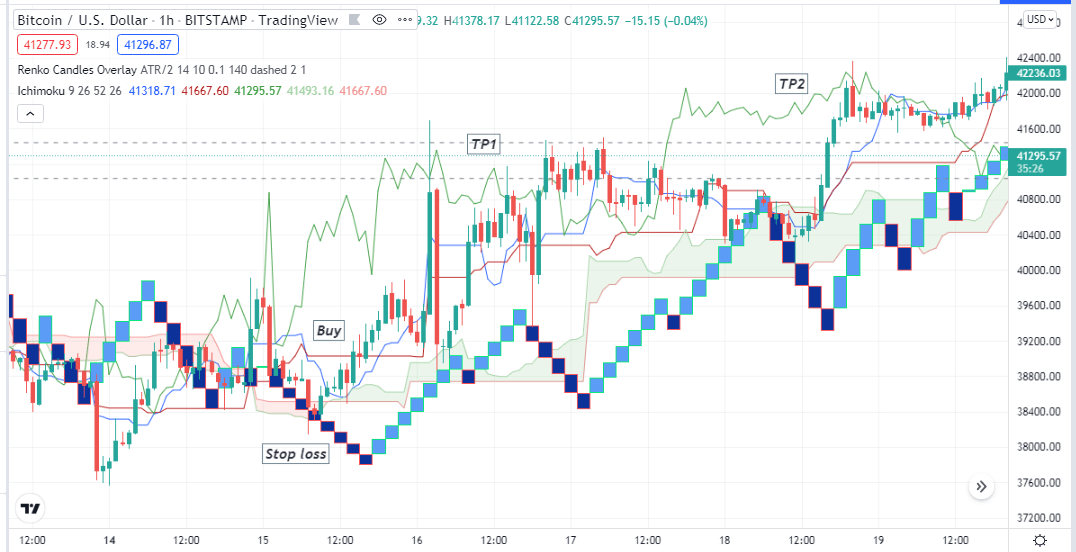
Bullish setup
Entry
Match these conditions above and open a buy position.
Stop loss
The initial stop loss level will be below the recent swing low with a buffer of 5-10pips.
Take profit
You can continue your buy order till the price remains above the green cloud. Close the buy position when:
- Renko bricks turn red.
- The Tanken-Sen line crosses below the Kijun-sen line.
- The Chikou Span line is crossing the price on the downside.
Bearish trade scenario
Apply both indicators at your target asset chart and seek to open buy positions when:
- The Tenkan-sen is below the Kijun-sen.
- The Chikou Span line is below price candles.
- Price candles are below the cloud (red or green).
- Renko red bricks appear and start making a series 45-degree angle on the upside.
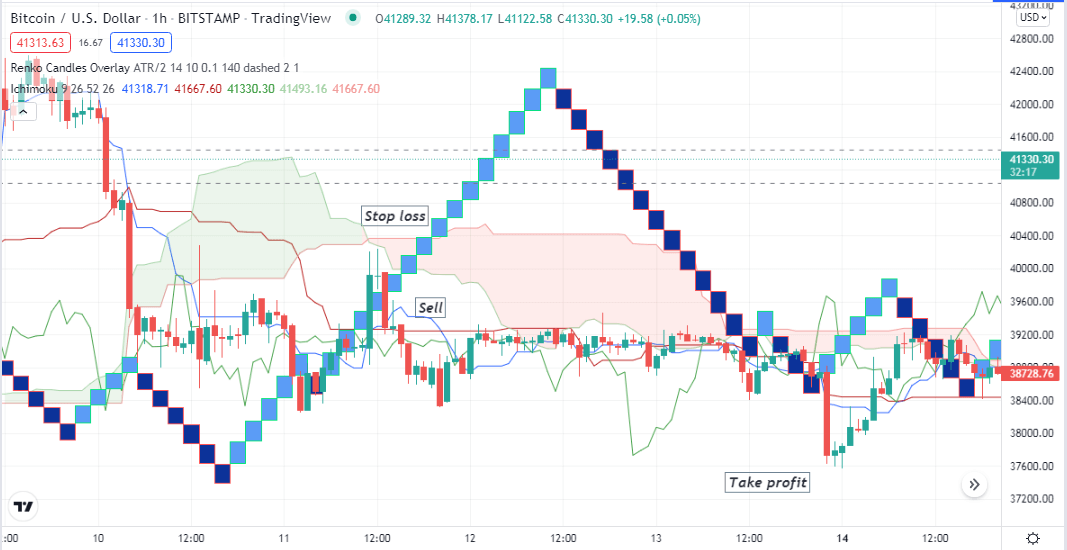
Bearish setup
Entry
Match these conditions above and open a sell position.
Stop loss
The initial stop loss level will be above the recent swing high with a buffer of 5-10pips.
Take profit
You can continue your sell order till the price remains below the red cloud. Close the sell position when:
- Renko bricks turn green.
- The Tanken-Sen line crosses above the Kijun-sen line.
- The Chikou Span line is crossing the price on the upside.
Long-term trading strategy
We use parabolic SAR and Hull moving average (20) alongside the Renko indicator to determine long-term trading positions in this trading method. The parabolic SAR shows the swing points when the price changes trends, and HMA declares trends. Meanwhile, the Renko indicator confirms both. This trading method suits many time frame charts; we recommend using an H4 or daily chart to catch the best long-term trades using this trading strategy.
Bullish trade scenario
Apply all three indicators at your target asset chart and observe when:
- Renko green bricks take place.
- Parabolic SAR dots take place below price candles.
- The price reaches above the HMA line, and the HMA line slopes toward the upside.
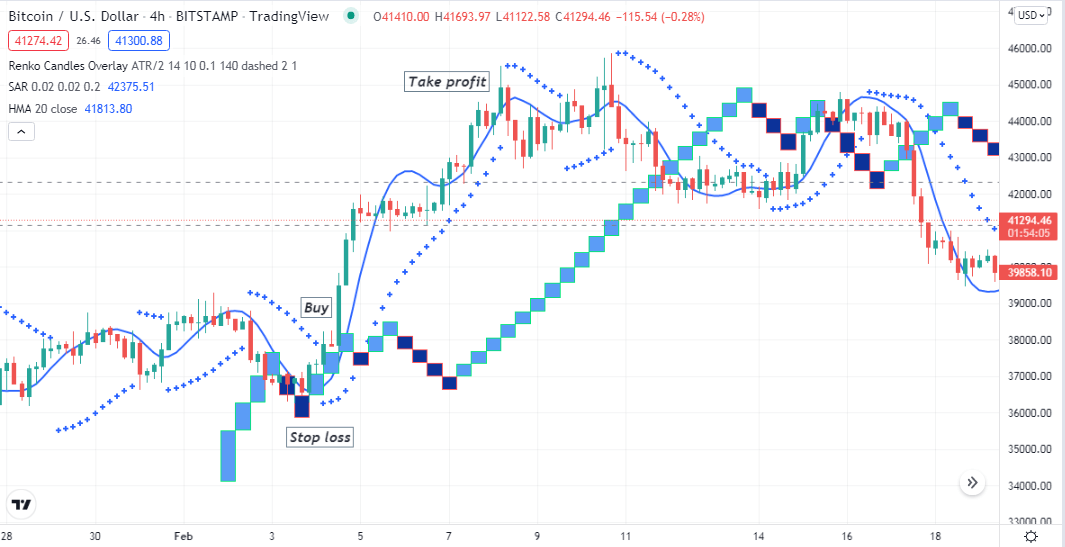
Bullish setup
Entry
When these conditions above match your target asset chart, open a buy position.
Stop loss
Place an initial stop loss below the recent bullish momentum.
Take profit
You can continue your buy order till the price remains on the uptrend. Close the buy order when:
- Red Renko bricks take place.
- Parabolic SAR dot switches on the upside of price candles.
- The price reaches below the HMA line, and the HMA line starts sloping on the downside.
Bearish trade scenario
Apply all three indicators at your target asset chart and observe when:
- Renko red bricks take place.
- Parabolic SAR dots take place above price candles.
- The price reaches below the HMA line, and the HMA line slopes toward the downside.
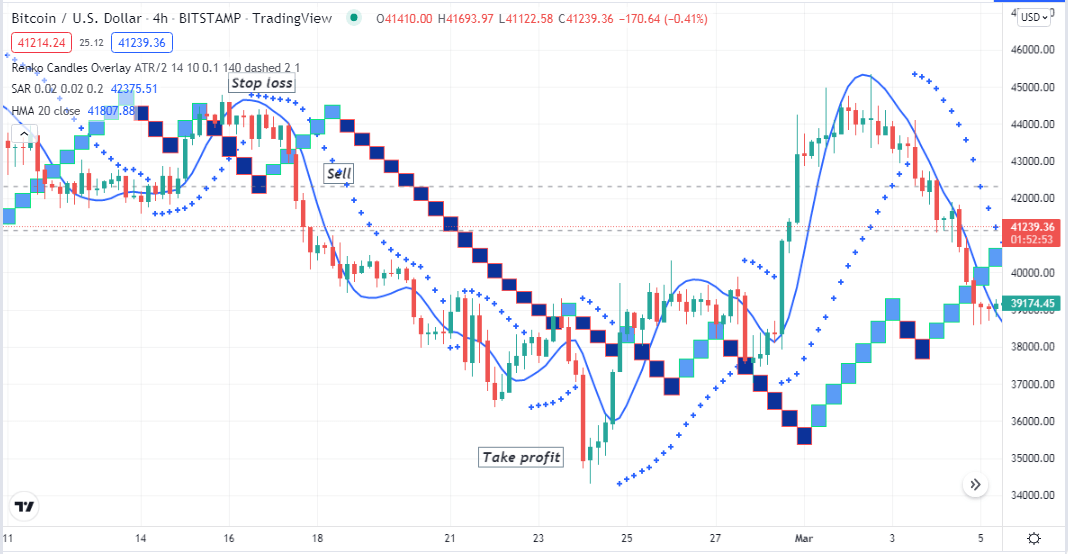
Bearish setup
Entry
When these conditions above match your target asset chart, open a sell position.
Stop loss
Place an initial stop loss above the recent bearish momentum.
Take profit
You can continue your sell order till the price remains on the downtrend. Close the sell order when:
- Green Renko bricks take place.
- Parabolic SAR dot switches on the downside of price candles.
- The price reaches above the HMA line, and the HMA line starts sloping on the upside.
Pros and cons
| 👍 Pros | 👎 Cons |
|
|
|
|
|
|
Final thought
For any trading strategy or chart type, losing trades are a natural part of trading. So it is better to follow good money and trade management rules while trading using any trading method.


Comments