
Coppock Сurve (CC) is a technical indicator famous as a crypto trading tool. Crypto traders use it to anticipate the crypto price movement. By applying the CC along with the other indicators, market participants may grasp taking decisions for market entry and exit.
Traditionally, the indicator effectively spots long-term trend shifts in the major markets. Traders can apply the indicator at any time and in any market to identify potential trend changes and provide signals.
However, the CC is a valuable momentum indicator that may be utilized only in the weekly and monthly charts. Despite that, the indicator is convenient since traders have more excellent data on what may occur at different times within their investment portfolio.
What is the Coppock Сurve?
Primarily, it was created for long-term monthly charts, which were appealing to long-term investors since the signals were not frequent in this time frame. Besides, dropping it down to a weekly, daily, or hourly time frame and the signs become more frequent. The indicator is obtained by taking a WMA (weighted moving average) of a market’s ROC (rate-of-change). In simple terms, it is a momentum indicator that oscillates over and under zero.
Moreover, the indicator has three available variables. Generally, the short and long rate-of-change periods are set at 11 and 14 consecutively, and the WMA is set at 10. The period specifies the number of bars used in the calculation of indicators. CC favored monthly price bars, yet traders are free to use any size for price bars and 1-minute, hourly, daily, and so on.
The CC is evaluated as a 10-month WMA of the total of the 14-month ROC and the 11-month ROC for the index. However, Coppock added the 11 and 14 ROC periods in the calculation because Episcopal bishops told that a person’s standard or average grieving period is 11 to 14 months. CC hypothesized downtrend is similar to a mourning period in which had Coppock utilized these numbers.
How to trade using the Coppock Curve?
The role of the trades trigger in the tool is played by the zero line. If it goes over the zero line, consider the buy signal, and contrariwise, if the CC moves under the zero line, it is a sell signal.
Traders may apply the sell-signal while closing out their long positions afterward, recommence long positions at the time of the CC crossing back over the zero line. Besides, traders who choose to be effective may close long positions while initiating short trades if they intertwine under the zero line.
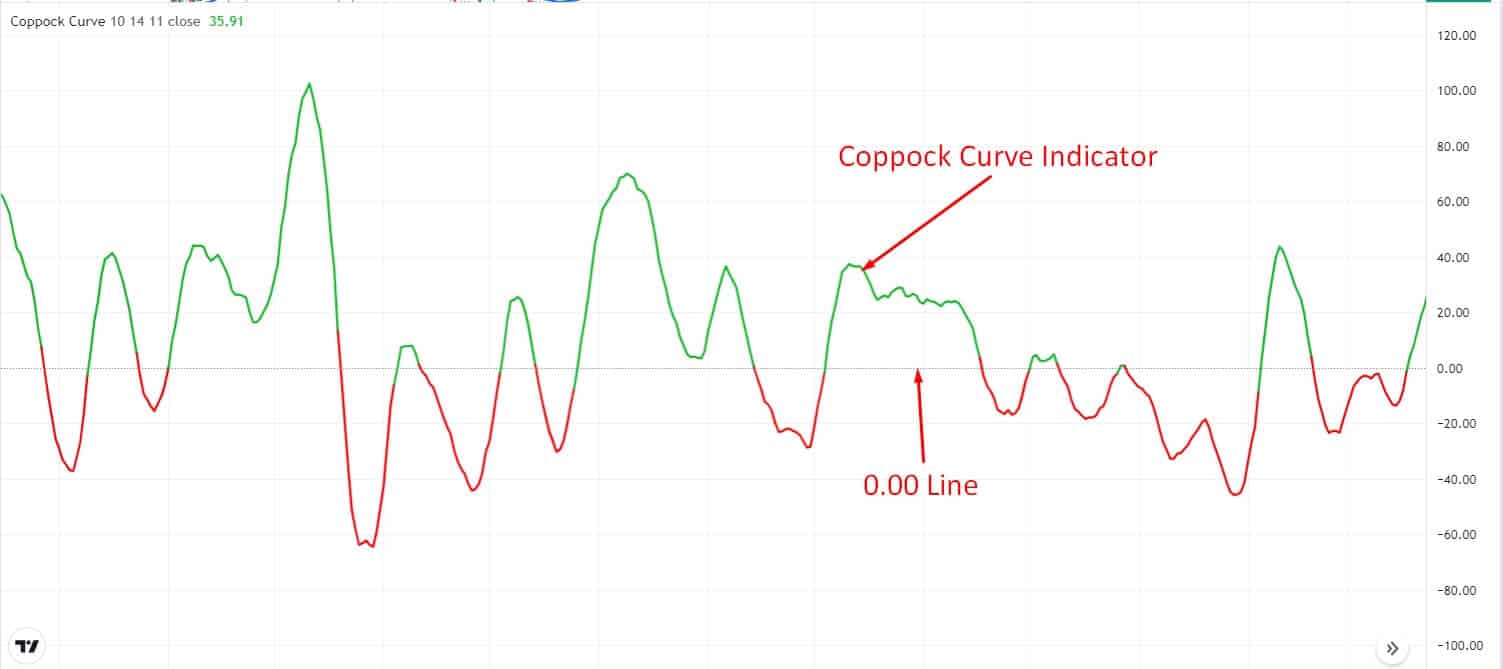
CC indicator
A short-term trading strategy
In this short-term trading strategy, we will add the indicator for the trade signal. Besides, we will add the Bollinger Bands (BB) indicator to understand the market momentum. Moreover, you can apply this strategy to the M5 and the M15 time frames.
Bullish trade scenario
First, you have to add the CC indicator to the chart. Besides, we will use the BB indicator to identify the market momentum and entry point. Moreover, the best time frames to use this CC crypto trading strategy is M5 and M15.
Short-term bullish trade scenario
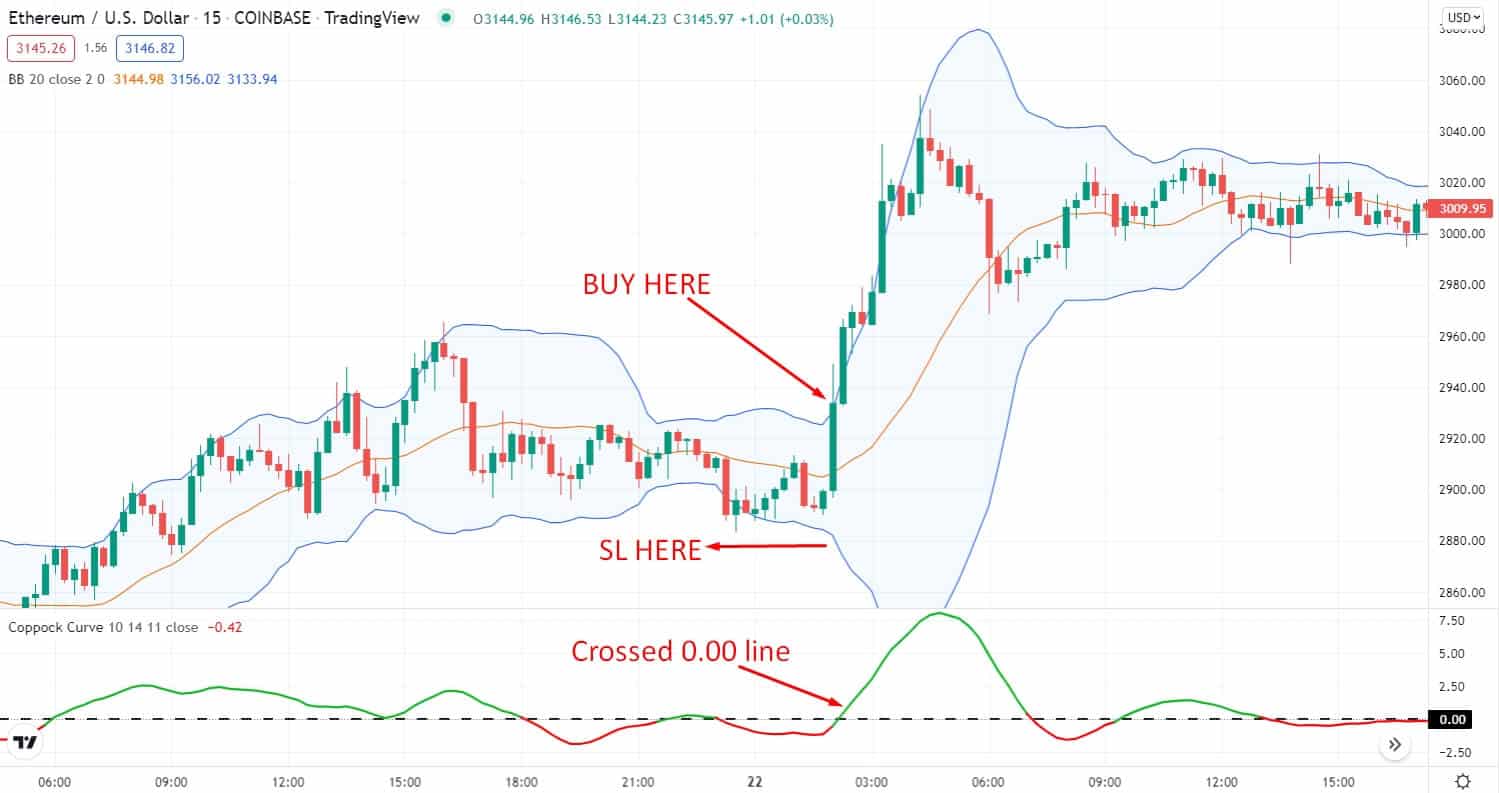
Entry
Look for a buy trade when the price bounces from the BBs’ lower band and has an impulsive bullish candle close above the BBs’ middle band. Also, the CC green line crossed the 0.00 line from down to up.
Stop-loss
Place the stop-loss order below the BBs lower band with at least 5-10 pips buffer.
Take profit
Take the profit by calculating at least a 1:3 risk/reward ratio.
Bearish trade scenario
First, you have to add the CC indicator to the chart. Besides, we will use the Bollinger Bands indicator to identify the market momentum and entry point. Moreover, the best time frames to use this CC crypto trading strategy is M5 and M15.
Short-term bearish trade scenario
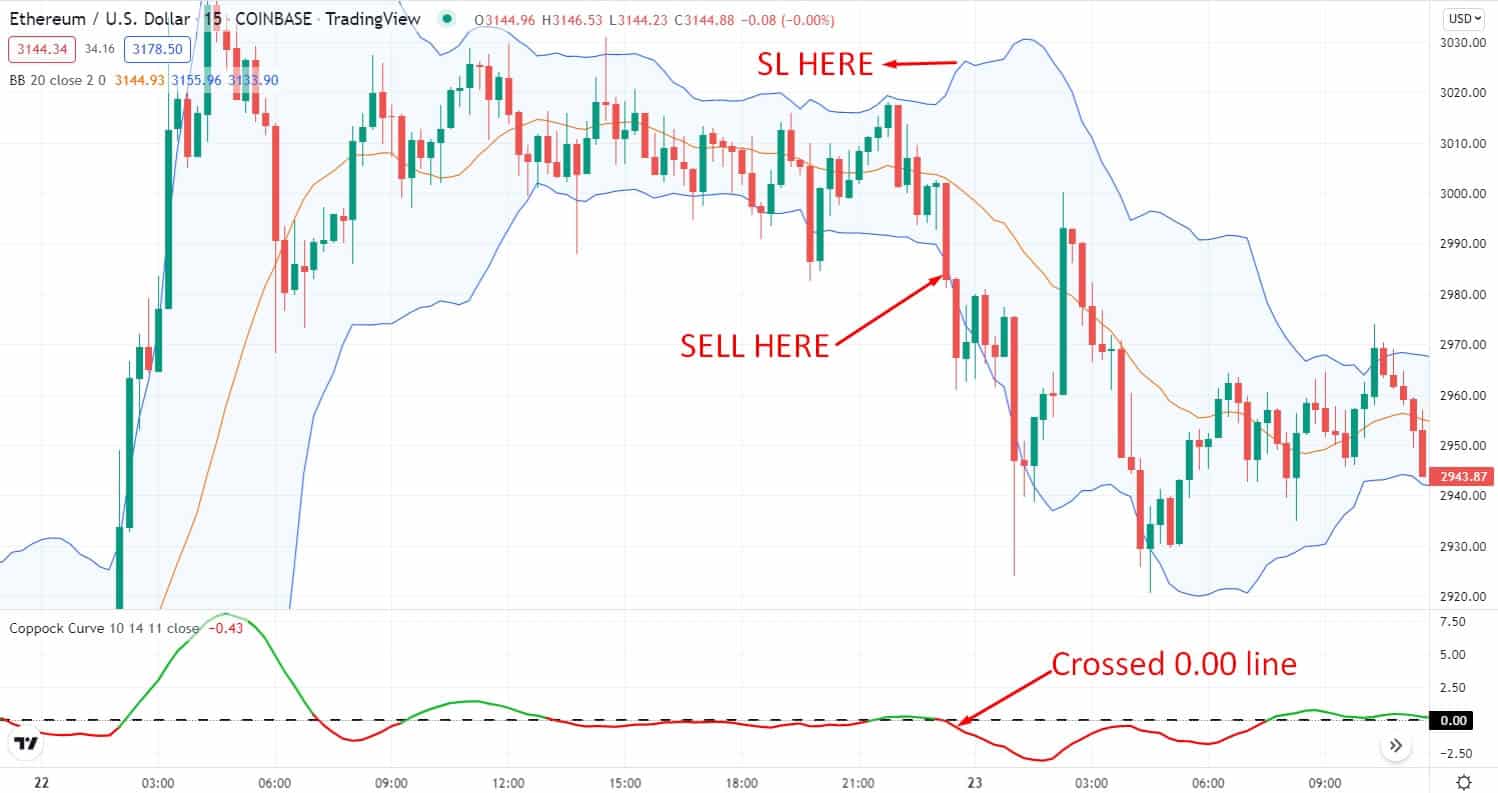
Entry
Look for a sell trade when the price rejects from the BBs’ upper band and has an impulsive bearish candle close below the BBs’ middle band. Also, the CC red line crossed the 0.00 line from up to down.
Stop-loss
Place the stop loss order above the BBs upper band with at least 5-10 pips buffer.
Take profit
Take the profit by calculating at least a 1:3 risk/reward ratio.
A long-term trading strategy
In this long-term trading strategy, we will add the indicator for the trade signal. Besides, we will draw the support and resistance level to understand the market structure. Moreover, you can apply this strategy to the H4 and the D1 time frames.
Bullish trade scenario
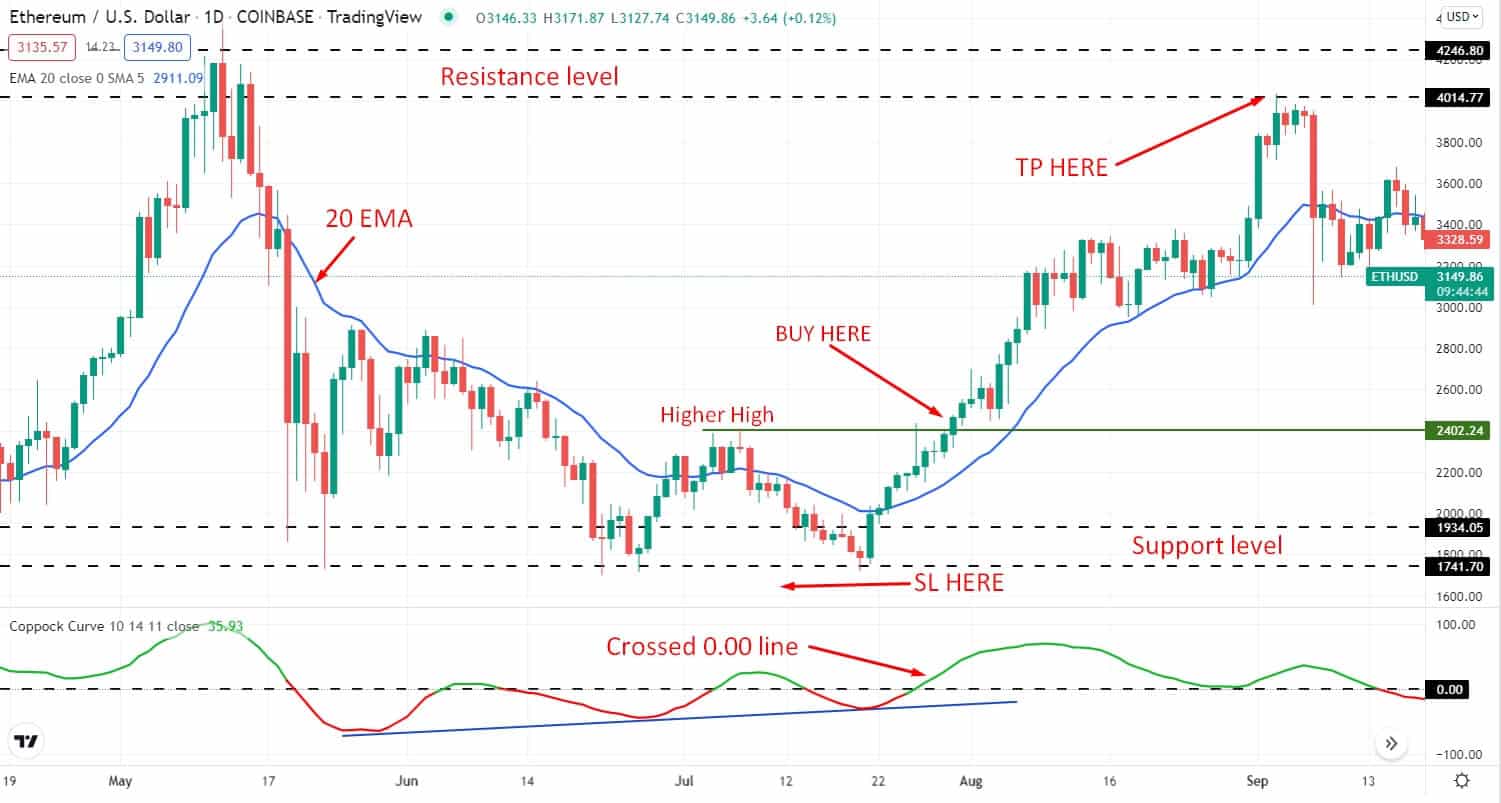
First, you have to add the indicator to the chart. Besides, we will use the 20 EMA indicator for further confirmation. Then, look for the price to bounce from the support level and break over the higher high with a daily bullish candle.
- CC green line crossed over the 0.00 level indicating an upcoming bullish bias.
- 20 EMA adds more confluence by residing below the price.
Long-term bullish trade scenario
Entry
Enter a buy trade when above mentioned all the trading conditions are met.
Stop-loss
Place the stop loss order below the support level with at least a 10-15 pips buffer.
Take profit
Set the take profit order by targeting the upcoming resistance level. Or else, you can take the profit by targeting at least a 1:3 risk/reward ratio.
Bearish trade scenario
First, you have to add the indicator to the chart. Besides, we will use the 20 EMA indicator for further confirmation. Then, look for the price to reject from the resistance level and break below the lower low with a daily bearish candle.
- CC red line crossed below the 0.00 level indicating an upcoming bearish bias.
- 20 EMA adds more confluence by residing above the price.
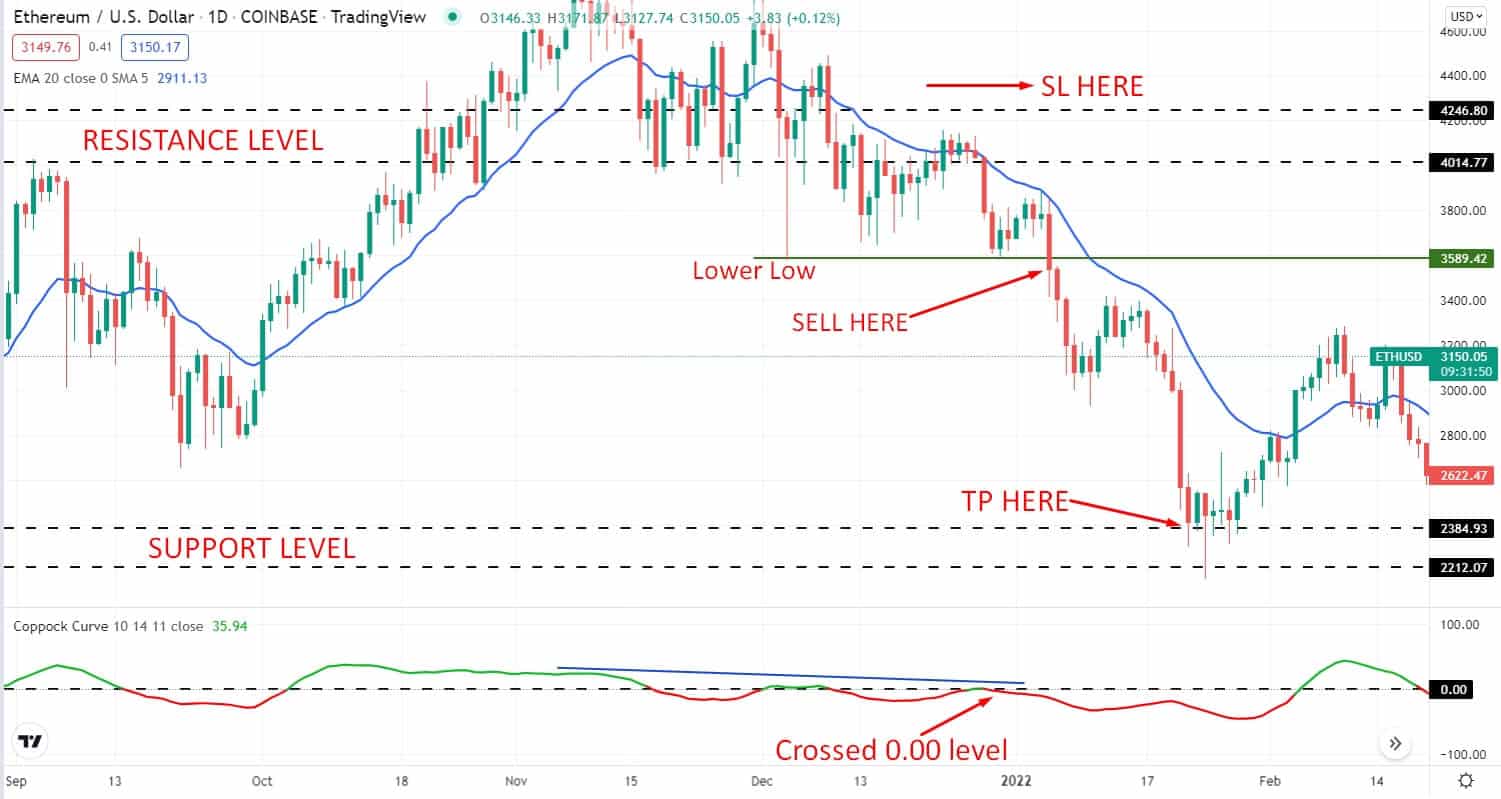
Long-term bearish trade scenario
Entry
Enter a sell trade when above mentioned all the trading conditions are met.
Stop-loss
Place the stop-loss order above the resistance level with at least a 10-15 pips buffer.
Take profit
Set the take profit order by targeting the upcoming support level. Or else, you can take the profit by targeting at least a 1:3 risk/reward ratio.
Pros and cons
| 👍 Pros | 👎 Cons |
|
|
|
|
|
|
Final thoughts
Finally, a momentum indicator was initially developed to identify the long-term trends’ changes. The indicator gives a good result in detecting these trend changes on the monthly chart.
On the other hand, short-term traders may still utilize the indicator only by making a few adjustments to the settings needed for the shorter period. Beforehand implement the strategy in the live market, It is advisable for the traders to trial the strategy on the preferred markets and timeframes to make the necessary adjustments.


Comments