
The Guppy Multiple Moving Average (GMMA) is a custom-made indicator that uses the concept of moving averages efficiently to generate trade ideas. It is a universal method applicable to many trading instruments, including cryptocurrencies, forex, commodities, stocks, etc. So it makes sense that crypto investors frequently rely on this indicator while making trade decisions.
However, it requires having a certain level of understanding alongside knowing the components of any indicator while seeking to use that indicator for successful crypto trading. This article defines the GMMA indicator and trading strategies using it.
What is the GMMA indicator?
It is a unique approach to utilizing the MA concept for successful trading. This indicator uses 12 different EMA lines to determine the potential breakouts, trends, trend switching points, etc.
An Australian financial columnist Daryl Guppy is the developer of this indicator concept. The author describes this concept in his book “Trading Tactics.” The author divides those 12 EMA lines into two groups:
- The short-term group
- The long-term group
Each of them contains six lines:
- The short-term group contains lines 3, 5, 8, 10, 12, and 15.
- The long-term group consists of 30, 35, 40, 45, 50, and 60-period lines.
How to trade crypto using the GMMA indicator?
This tool is a straightforward technical indicator to apply to any financial asset chart. Smart crypto investors can easily use this concept on any crypto-asset chart. For example, look at the chart below; it represents two groups with different colors.
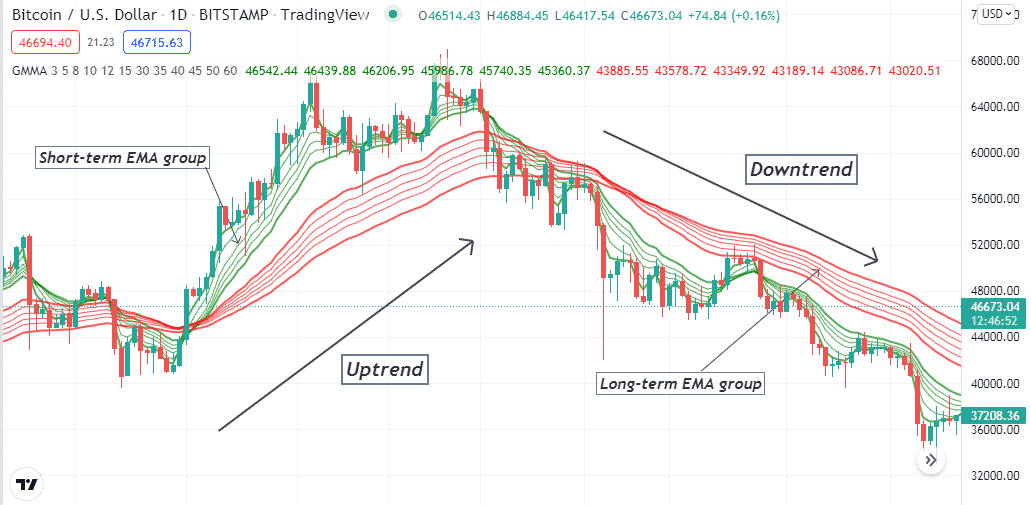
Different trends by GMMA indicator
The six EMA lines of the short-term group are green, and the other six EMA lines of the long-term group are red.
- When a bullish momentum initiates, the green EMA lines surpass the red EMA lines on the upside.
- Conversely, the green EMA lines drop below the red EMA lines, declaring a bearish momentum initiation.
You can participate in unlimited winning trades using this concept of GMMA indicator independently or combine other technical indicators or tools readings to determine more efficient trading positions.
Short-term trading strategy
We use another popular technical indicator alongside the GMMA indicator to identify short-term trading positions in this trading method. We use the volume indicator that shows buying or selling pressure on the asset price through histogram bars of different colors. Green histogram bars represent buyers’ domination of the asset price, and red bars represent sellers’ domination. We recommend using a 15 min or hourly chart to chart the most potent short-term trades through this trading method.
Bullish trade scenario
Apply both indicators in your target asset chart and seek to open buy positions when:
- The price reaches above all EMA lines of the short-term group.
- The EMA lines of the short-term group reach above the EMA lines of the long-term group.
- The volume indicator shows increasing buy volume.
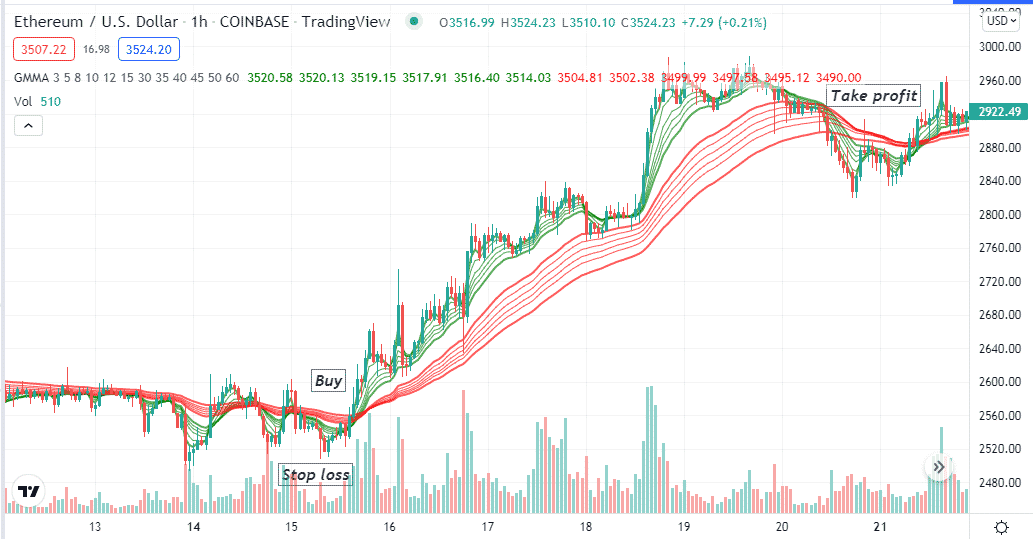
Bullish setup
Entry
Match these conditions above to confirm the asset price enters a bullish trend and suggests opening a buy position.
Stop-loss
The initial stop loss level will be below the current swing low with a buffer of 5-10 pips.
Take profit
Close the buy order when:
- The price reaches below the EMA lines of the short-term group.
- The green EMA lines drop below the red EMA lines.
- The volume indicator declares an increasing sell pressure.
Bearish trade scenario
Apply both indicators in your target asset chart and seek to open sell positions when:
- The price reaches below all EMA lines of the short-term group.
- The EMA lines of the short-term group reach below the EMA lines of the long-term group.
- The volume indicator shows increasing sell volume.
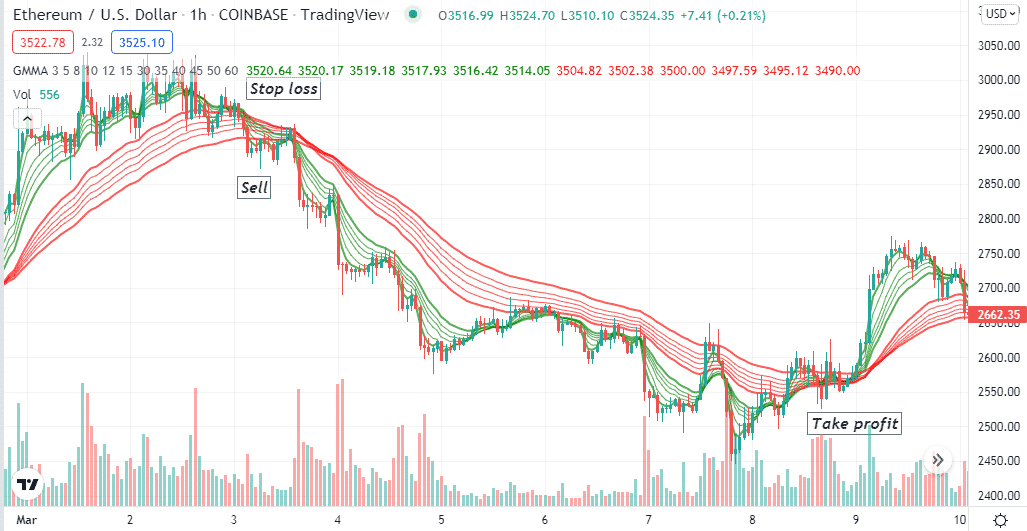
Bearish setup
Entry
Match these conditions above to confirm the asset price enters a bearish trend and suggests opening a sell position.
Stop-loss
The initial stop loss level will be above the current swing high with a buffer of 5-10 pips.
Take profit
Close the sell order when:
- The price reaches above the EMA lines of the short-term group.
- The green EMA lines reach above the red EMA lines.
- The volume indicator declares an increasing buy pressure.
Long-term trading strategy
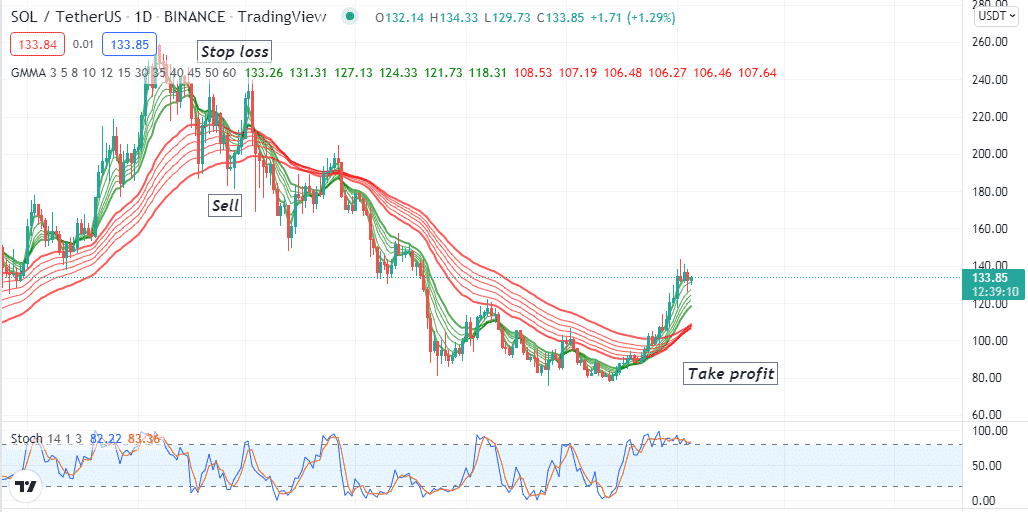
We use the stochastic oscillator alongside the GMMA indicator in this long-term trading method. The stochastic indicator shows readings on an independent window containing two dynamic signal lines floating between 20-and 80, declaring overbought and oversold levels. Crossovers between those dynamic lines declare bullish/bearish momentums. This method suits many time frame charts; we recommend using an H4 or D1 chart to catch the most potent long-term trades.
Bullish trade scenario
This method suggests opening a buy position when:
- The price reaches above the EMA lines of the short-term group.
- The EMA lines of the short-term group get above the EMA lines of the long-term group.
- The dynamic blue line reaches above the dynamic red line near the stochastic window’s bottom (20) line.
- Both dynamic lines of the stochastic oscillator window are heading toward the upper (80) level.
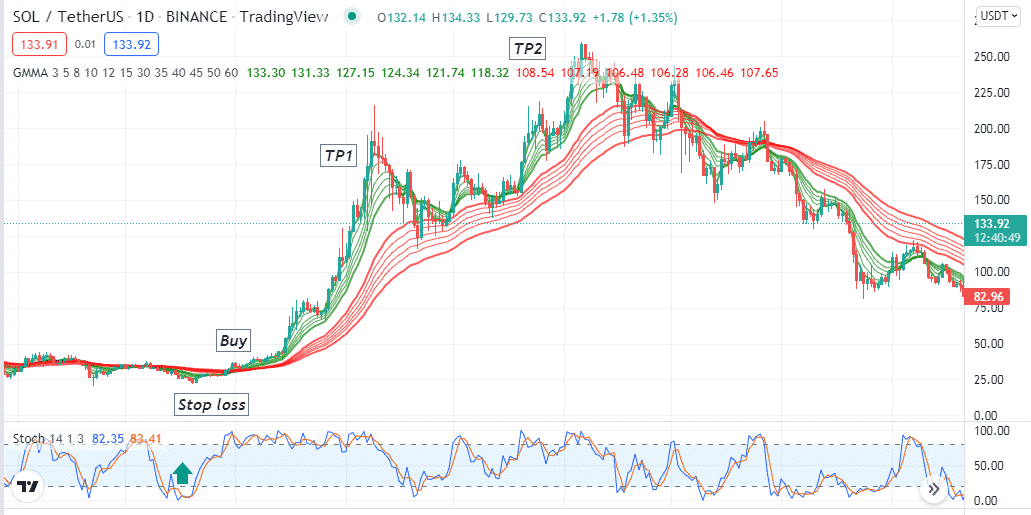
Bullish setup
Entry
These conditions above declare an initiation of a potential bullish trend. Enter a buy order.
Stop-loss
The initial stop loss will be below the current bullish momentum.
Take profit
Close the buy order when:
- The price reaches below the EMA lines of the short-term group.
- The EMA lines of the short-term group drop below the EMA lines of the long-term group.
- Both dynamic lines of the stochastic oscillator window reach above the upper (80) line or start dropping after reaching that level.
Bearish trade scenario
This method suggests opening a sell position when:
- The price reaches below the EMA lines of the short-term group.
- The EMA lines of the short-term group reach below the EMA lines of the long-term group.
- The dynamic blue line reaches below the dynamic red line near the top/upper (80) line of the stochastic window.
- Both dynamic lines of the stochastic window are heading toward the lower (20) level.
Bearish setup
Entry
These conditions above declare an initiation of a potential bearish trend. Enter a sell order.
Stop-loss
The initial stop loss will be above the current bearish momentum.
Take profit
Close the sell order when:
- The price reaches above the EMA lines of the short-term group.
- The EMA lines of the short-term group reach above the EMA lines of the long-term group.
- Both dynamic lines of the stochastic oscillator window reach below the lower/bottom (20) line or start increasing after reaching that level.
Pros and cons
| 👍 Pros | 👎 Cons |
|
|
|
|
|
|
Final thought
Finally, you can list this indicator among the most potent indicators to execute constantly profitable trades for crypto trading. We suggest following proper trade and money management rules while using any GMMA indicator crypto trading strategy.


Comments