Financial traders often depend on many trading indicators to obtain the market context. These indicators allow identifying the most potential entry/exit positions on financial instruments. The Detrended Price Oscillator is one of the unique and valuable technical indicators that can help traders find the precise price direction.
The oscillator interprets the market context by calculating past price movements like other indicators. Therefore, it requires a common understanding before implementing it in the real price chart.
If you are interested in building a trading portfolio using this indicator, the following section is for you. Here you will see how the indicator works, including a complete guideline to execute trades.
What is the Detrended Price Oscillator indicator?
It is among oscillator indicators, like the absolute price oscillator (APO) or percentage price oscillator (PPO). This indicator ignores the long-term trend, separates the short-term trend, and shows it to users by calculating the difference between the past price of a particular period relative to that period’s simple moving average. Any reading higher than the SMA by this indicator suggests an overbought condition on that asset price. Meanwhile, when the reading is lower than that SMA value, it declares an oversold condition on the asset price. The DPO is not among the momentum oscillator indicators.
How to trade using the DPO indicator
It is a unique indicator that can be useful to any financial trader or investor who has sufficient knowledge of the working procedure of this indicator. Using it, you can execute trades and get enormous profitable trading positions following simple guidelines. This part will explain the step-by-step process of using the DPO indicator to create trading techniques.
Step 1. Identify the market context
The DPO indicator shows readings in an independent window between -0.01 to 0.01. That also has a central (0.0) line. Meanwhile, a dynamic line changes due to market contexts and price movement phases. The DPO indicator use equation.
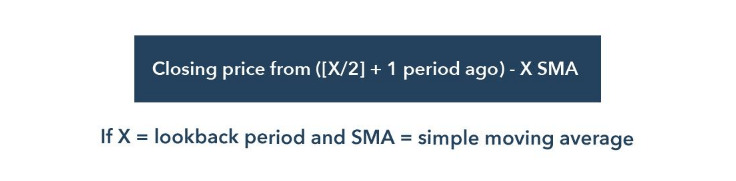
DPO equation
In this equation, X is the DPO’s number of periods to calculate. When the DPO value gets above the central (0.0), it indicates the trading instrument has sufficient buy pressure to make an upward pierce movement.
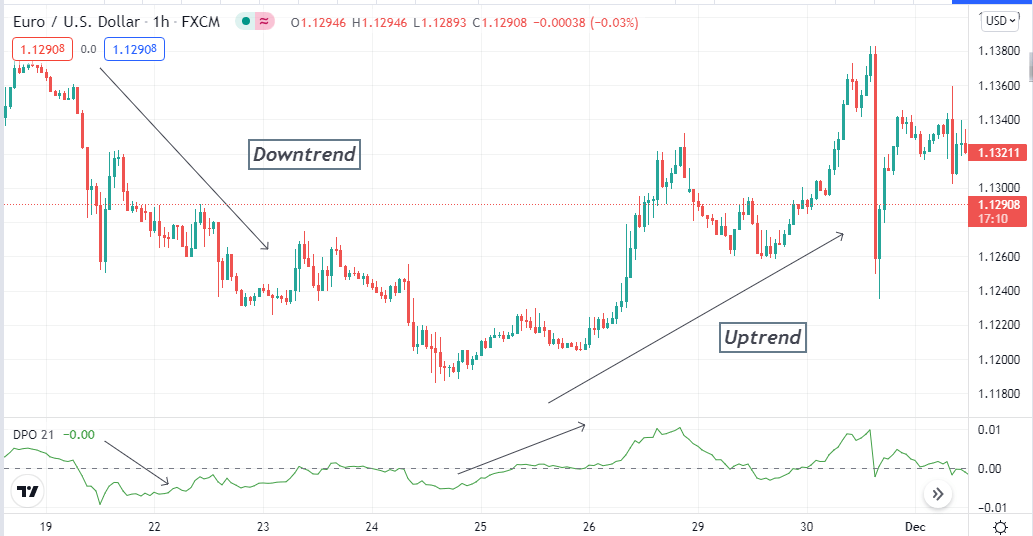
The DPO indicator identifies different trends
Meanwhile, when the DPO value drops below the central (0.0) line, it declares a declining pressure on the asset price may continue downward for a while. The dynamic line reaches the 0.01 level or above; it indicates that the asset price gets to an overbought level. Conversely, the dynamic line is at -0.01 or below; it declares the asset price reaches an oversold condition.
Step 2. Try to combine the DPO with other indicators
The DPO is a precious indicator when making trade decisions. For precious entry/exit positions for executing any trade, you can use other supportive indicators to create an acceptable trading strategy.
This trading indicator applies to many trading instruments. For instance, you can use this indicator to trade forex pairs, cryptocurrencies, commodities, stocks, etc. Combining other indicators will increase your success rate in executing trades.
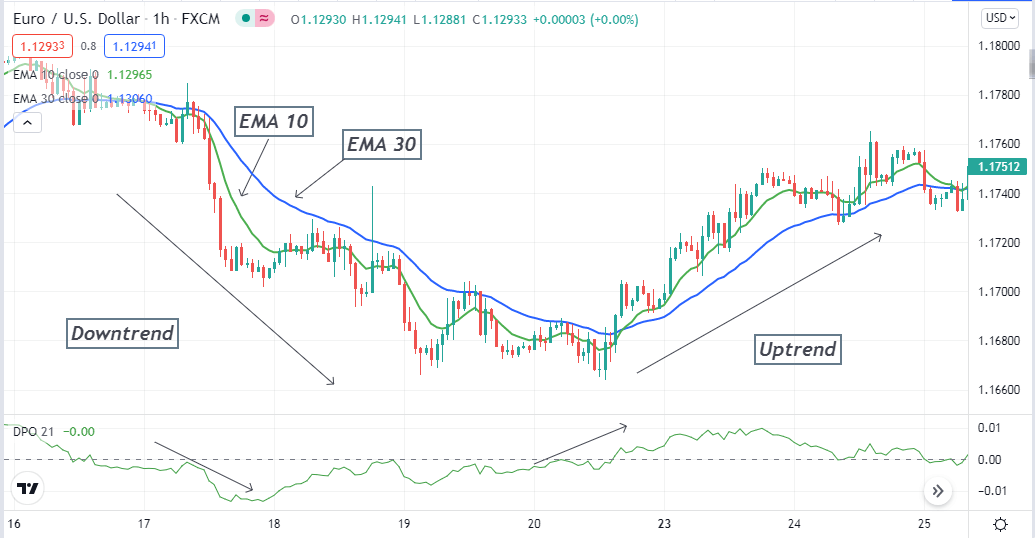
Different trends by combining the DPO and EMA crossover
For example, you can use the EMA crossover technique beside the DPO indicator. Suppose you use EMA 10 and EMA 30 on your target asset chart. When the small EMA line crosses the large EMA line on the upside, and the DPO value rises above the central (0.0) line, it generates the most potent buy position.
On the other hand, the exact opposite crossover between those EMA lines
and the DPO value drops below the central (0.0) line signals to open a sell position. You can use many other indicators such as RSI, MACD, Parabolic SAR, etc., to combine with this indicator.
Step 3. Move to upper time frames
Any trading strategy depends on several factors such as time frame, capital size, trading technique, trading instruments, etc. The time frame is essential as traders of different levels conduct analysis using various time frames.
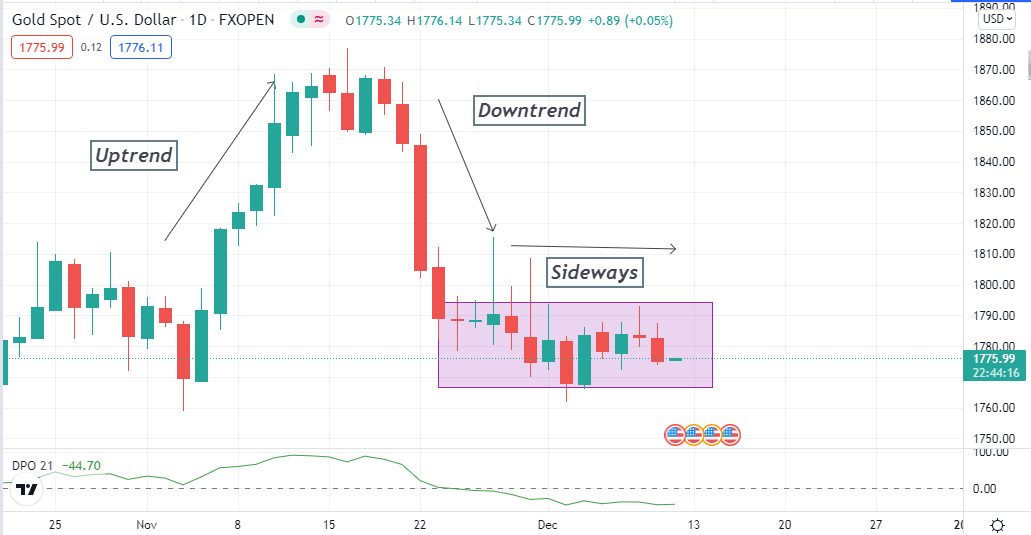
XAU/USD daily chart
For example, scalpers may use time frames between 1min-hourly charts. Meanwhile, position traders may use time frames between 4hour-weekly. The upper time frame charts will give you the actual idea about the price direction of any trading instrument.
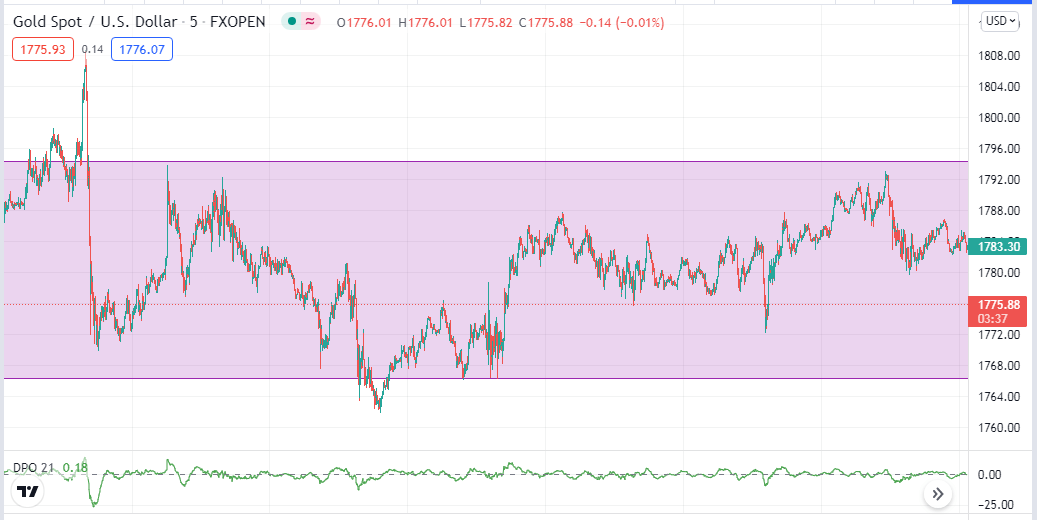
XAU/USD 5-min chart
Moreover, you can avoid the fake swing high/low levels of smaller time frame charts. Smart traders often check on upper time frame charts to obtain birds-eye views on their target asset before making trade decisions.
Step 4. Use other fundamental info
Fundamental events affect the price movement of any trading instrument. The DPO indicator will generate trade ideas depending on the technical market context, while many other fundamental events may create unexpected vast movement on the asset price.
For example, any stock’s earnings and revenue data can affect that stock index to face a sharp fall or a sudden spike. So it is better to check on these data from any reliable site before making trade decisions.
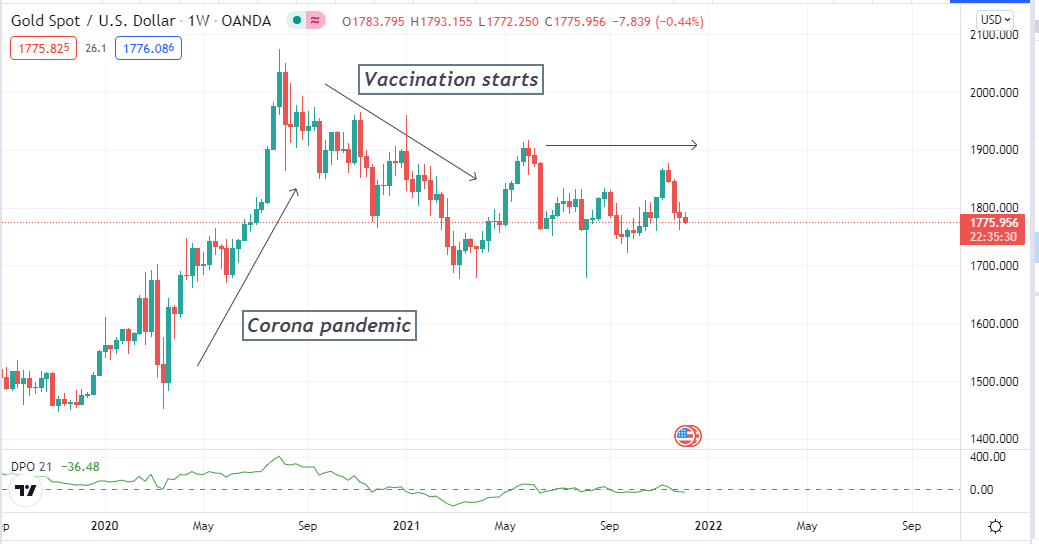
XAU/USD weekly chart
Another example is the recent Covid-19 pandemic, and lockdown worldwide was the reason behind the gold spike, and the XAU/USD pair made a high near 2070$. Meanwhile, the invention of the corona vaccine removes fear. With the reopening, investors again start to invest in other assets, and gold becomes less demandable and declines more than 300$ from the peak.
Step 5. Use money and trade management concepts
When using the DPO indicator for executing trades, follow fair trade and money management rules to execute precious trades. Use appropriate stop losses for open positions by risking only 2-5% of your trading capital, according to most professional traders.
For example, you may use the Parabolic SAR beside the DPO indicator. Then open a buy position; when the parabolic dot takes place below price candles, the DPO value crosses the central 90.0) line. Place a stop loss below your opening position’s current swing-low level. Meanwhile, the take profit level will be where the parabolic dot switches on the upside of price candles or drops the DPO value at 0.0 line or below it.
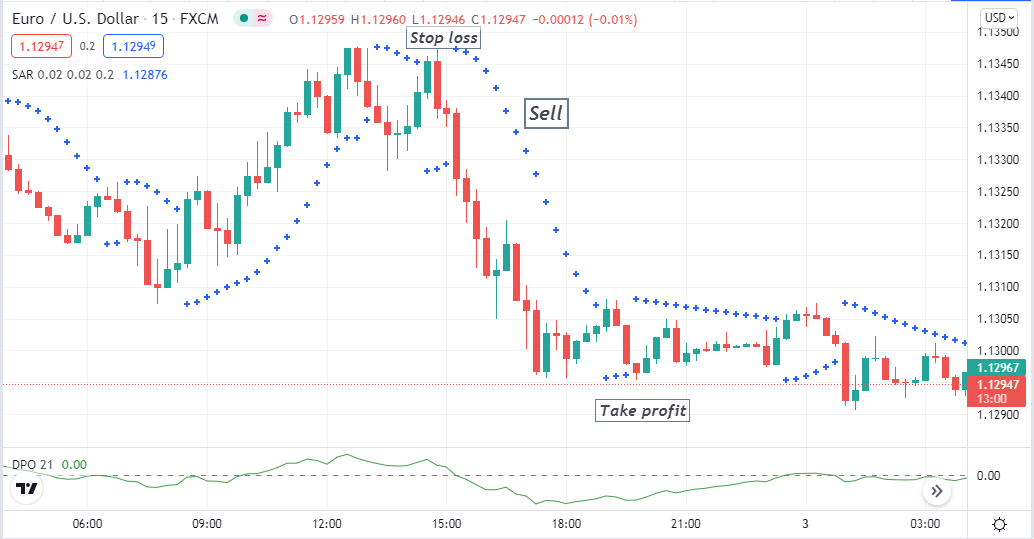
Bearish setup
On the other hand, the bearish trade setup suggestions will be the exact opposite appearance of those indicators.
Final thought
This article introduces you to a very potent oscillator indicator, the DPO. We hope you find this article sufficiently informative and educational. We suggest following these guidelines above to master the concept and create sustainable trading strategies with DPO.


Comments