
Every candle represents participants’ actions during any specific period in any FX trading chart. So no wonder that financial traders and technical analysts always seek those candle formations to create potentially profitable trading methods. The Roof pattern is a unique one of such patterns that represents a clear story about what bulls and bears are doing with the price.
This article contains a description of the Roof pattern. Additionally, you will see trading methods using this pattern with chart attachments for better understanding. However, executing trades using any pattern depends on learning the complete formation and using procedures about any pattern.
What is the Roof pattern?
It is a candlestick formation that usually takes place at any uptrend signaling both an extension of the current uptrend or a reversal depending on market context. It is a relatively new formation that Thomas Bulkowski introduced back in 2005. Swing traders get a glimpse of this pattern from a company in the neutral gas industry, New Jersey Resources Corp (NJR), and start considering this pattern as potent to create opportunities to execute successful trades.
Roof pattern
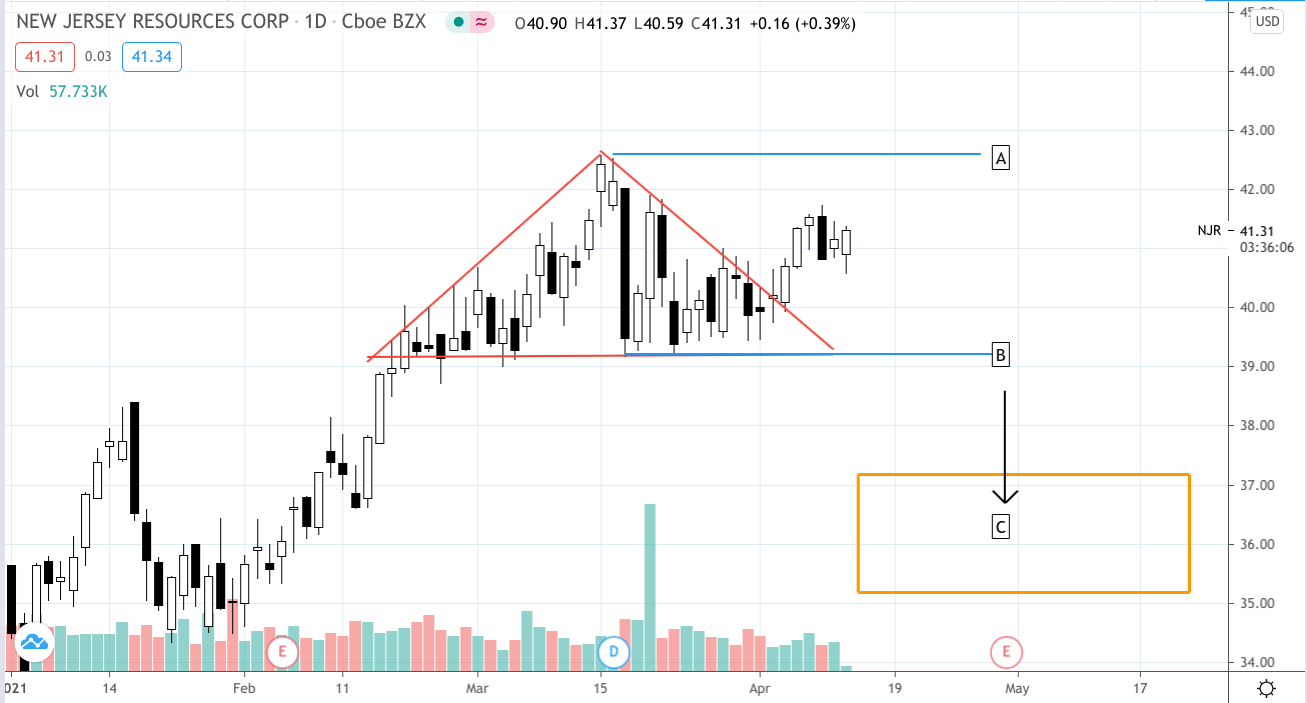
The chart above shows a Roof pattern. We see a sharp rise in the price to the top near point A. Then the price reaches the point B level and creates a support level, or you may consider it a neckline. So this pattern contains two slope lines and a horizontal or neckline. Between those sloping lines, one declares an uptrend, and the other declares a downtrend. These create the complete Roof pattern that you can spot on any financial asset chart.
How to trade using the Roof pattern?
Now you know what the Roof pattern is. Executing trades through this pattern is not such a complicated cause after the entire formation; two possible outcomes can come. Either the price breaks below the support or neckline level or breaks above the downward trendline. If the price breaks below point B, that will generate a trading signal to make a sell order, valid until point C. Otherwise, if the price declines to cross below point B, it can bounce toward point A level to create another peak or continue to increase more.
The breakout can occur in any direction; the downward possibility is 58%. Note that this pattern generates good trading ideas at upper timeframe charts such as daily or weekly charts, although the Roof trading strategy also suits lower timeframes. In that case, you can use many technical indicators to determine entry/exit positions.
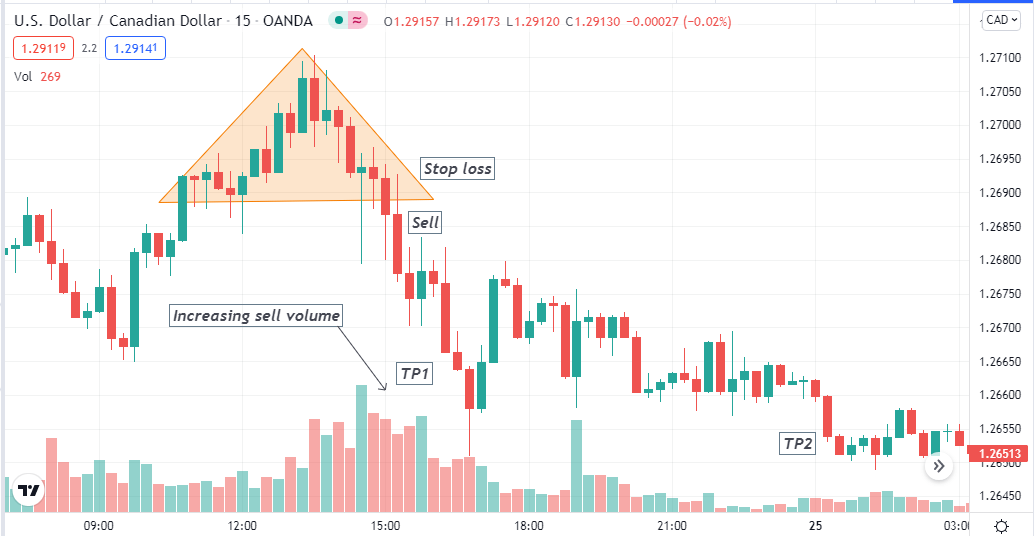
For example, apply volume indicator, confirm the breakout by observing price movement and readings from the indicator. A downward breakout and increasing sell volume are potent to place a sell order. Additionally, confirm the breakout by checking on the candle closing; otherwise, it can be a fakeout. So it will be wise to execute trades only after a valid breakout.
A short-term trading strategy
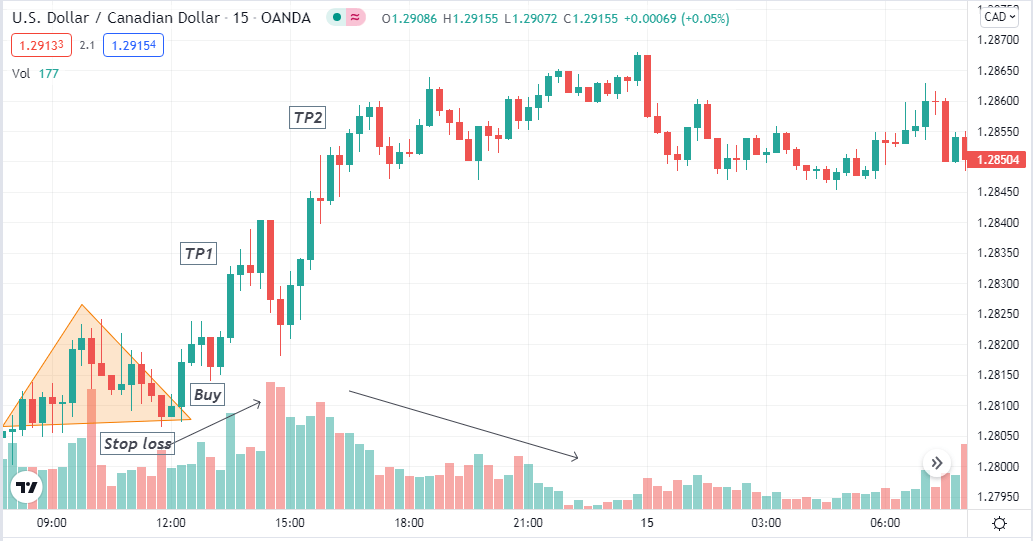
This short-term trading method uses the volume indicator beside the Roof pattern to determine trading positions. The concept is simple: using a volume indicator will confirm the breakout and make entry. Use a 15-min chart to make precious short-term trading positions, although this method suits any trading charts. Additionally, try opening positions during London or US sessions while using short-term charts.
Entry
Bullish setup
Enter a buy order when a breakout occurs on the upside of the Roof pattern. Wait till the current bullish candle closes, and the volume indicator declares an increasing buy volume.
Bearish setup
Meanwhile, when a breakout occurs on the downside, and the volume indicator declares increasing sell volume, enter a sell order.
Stop loss
The reasonable stop loss for every order you execute through this trading method. Place a stop loss below the neckline when placing a buy order. Meanwhile, a reasonable stop loss will be above the downsloping trendline for a sell order.
Take profit
The initial profit target will be the same distance above or below the same distance as the Roof pattern range for buy or sell orders. You can also extend your profit target according to the market context.
A long-term trading strategy
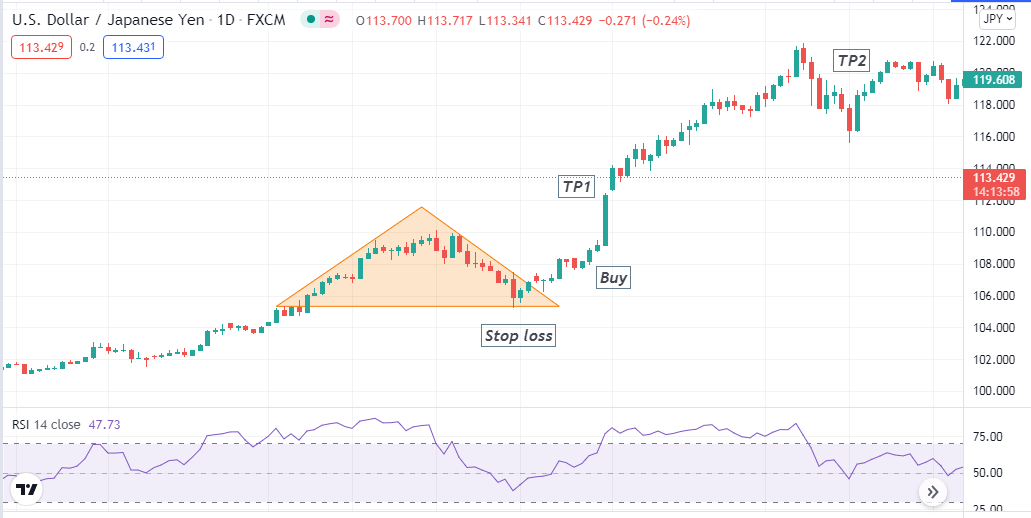
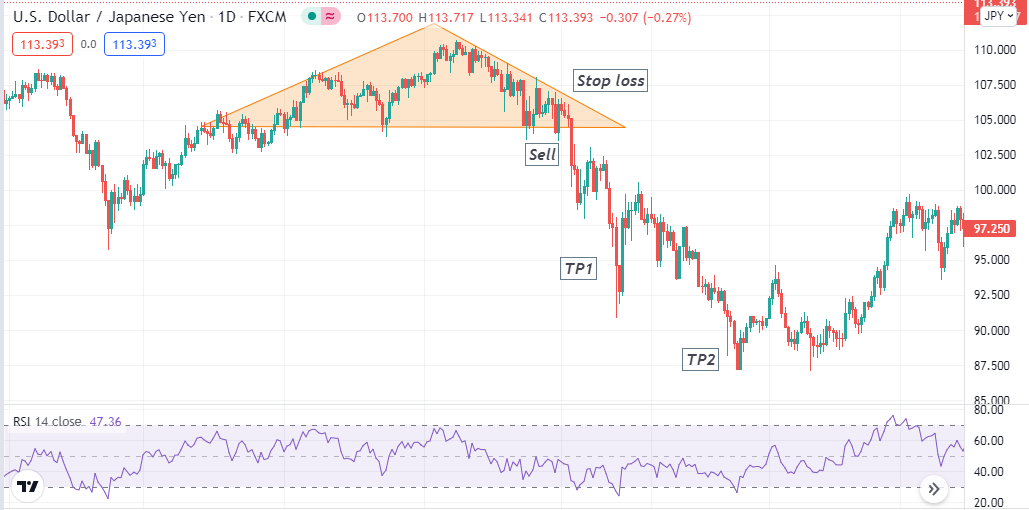
Besides the Roof pattern, we use the RSI indicator, one of the most popular momentum indicators in this long-term trading method. When a breakout occurs, then confirm the momentum from the RSI indicator window. Then enter trades according to the market context. The best time frame for this trading method is a daily chart.
Entry
Bullish setup
Set the RSI indicator and wait for breakout to occur in any direction outside the Roof pattern range. Check the RSI indicator window when the price breaks above the downsloping trendline. When the RSI line is above the central (50) line and heading toward more upside, open a buy position.
Bearish setup
Meanwhile, check the RSI window when the price breaks below the support or neckline; the RSI signal line is below the central (50) line and heading toward more downside. Open a sell position.
Stop loss
The reasonable stop loss level for any buy order will be below the neckline or support level, and it will be above the downsloping trendline if you open a sell trade following this trading method.
Take profit
Continue your trades according to the market context. The initial profit target for your buy order will be above the same distance as the Roof range. Otherwise, close the buy order when the RSI line reaches the upper (70) line or decline toward the middle (50) line after reaching that overbought level.
On the other hand, the initial profit target will be below the breakout level at the same distance as the Roof pattern size. Otherwise, close the sell position when the RSI line reaches the lower (30) level or starts to rise toward the central (50) line after reaching that oversold level.
Pros and cons
| 👍 Pros | 👎 Cons |
|
|
|
|
|
|
Final thought
The roof pattern strategy applies to many trading assets such as commodities, currency pairs, stocks, indices, cryptocurrencies, etc. Combining this pattern formation with other technical tools and indicators enables more accurate trading positions. We suggest executing trades only after a valid breakout and drawing the entire pattern carefully.


Comments