
You can consider the turtle trading method an extraordinary approach to the marketplace that is a proven method. An investor who follows discipline or rules when making trade decisions can participate in more profitable trades and reduce risks on capital. So it makes sense that following trading rules like the turtle strategy are crucial to being a successful crypto trader.
However, when someone is interested in implementing the turtle trading strategy in crypto trading, it is essential to know the rules and skills to apply to crypto-assets. This article will introduce the turtle trading method and trading strategies using the breakout and trend-following method.
What is the crypto turtle trading strategy?
Richard Dennis, a famous American trader, wrote his name in history for successful trading. He made nearly $100 million from an investment of $5000. He entered the market with his friend William Eckhardt in the 1980s.
Dennis comes with the belief that anyone can learn to trade, while his partner Eckhardt doubted that statement and declared that his success of Dennis was related to a special gift. However, the belief led Dennis to teach novice traders trading, and he invested his money in them to manage. The students were the “turtles,” and the experiment was the turtle experiment. Dennis made a list of 14 rules that are a brief discussion. Let’s check on the basic rules of the turtle experiment:
- The trading market rule
The first rule was to trade futures contracts and seek a highly liquid market as it enables them to enter without moving the market.
- Position sizing rule
Turtles depend on the position sizing algorithm that enables maintaining the same position irrespective of the market and improves diversification.
- Entry rules
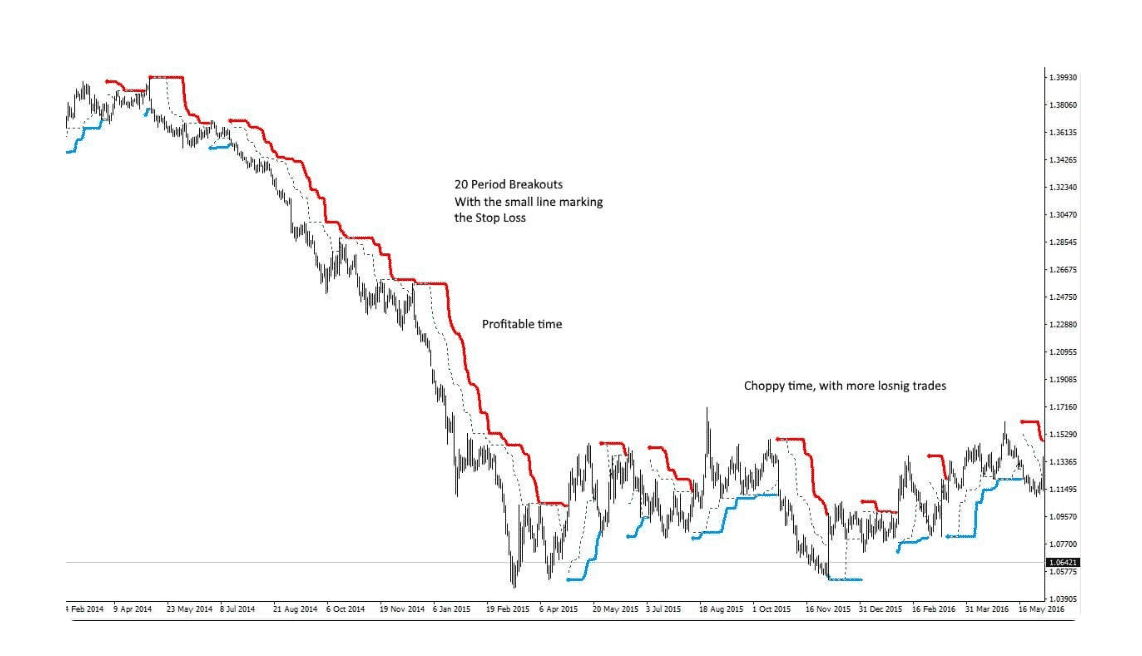
Turtles use two entry rules: a 20-day breakout and a 55-day breakout.
- Stop-loss rule
Novice traders learn how to place the stop loss effectively in the turtle experiment. They never took significant risks and always practiced determining stop-loss levels before entering trades.
- Exit rules
Turtles were intended to limit exiting from trades too early that many trend-following traders suffer.
- Tactics
In this rule, turtles follow tactics to deal with the fast-moving market and use limit orders.
When any crypto trader uses these rules on crypto trading, that is a crypto turtle trading strategy.
How to trade using the strategy?
Turtle crypto strategy
So you learn the basic turtle trading rules now it is time to implement them successfully. You can use several trading indicators to mark breakout levels and trend-following trade suggestions within these rules. So it makes sense that crypto turtle traders rely on several technical indicators like Bollinger Bands, moving average, RSI, MACD, MA crossover, etc., while making trade decisions. They use these indicators as these technical tools help them to determine breakouts and trend momentums.
Short-term trading strategy
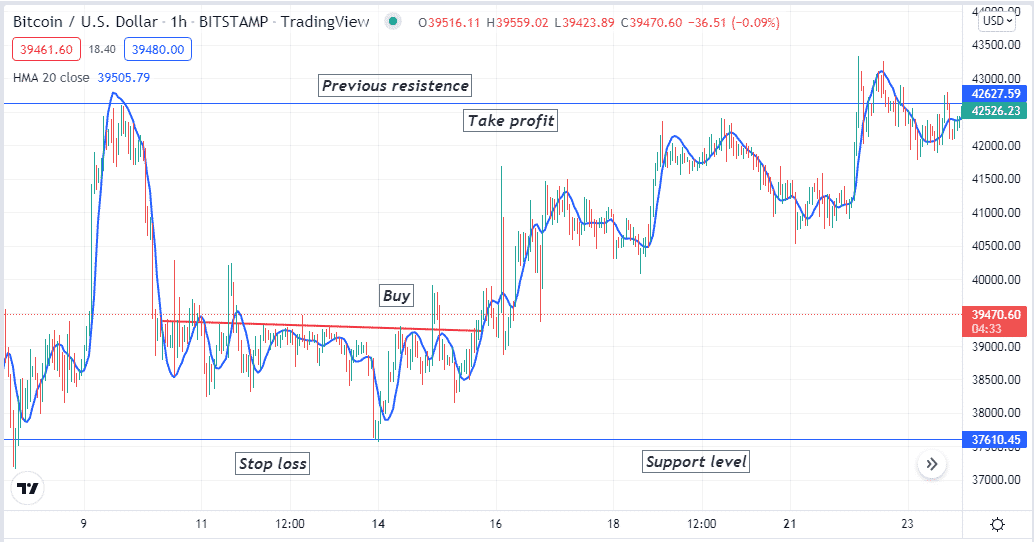
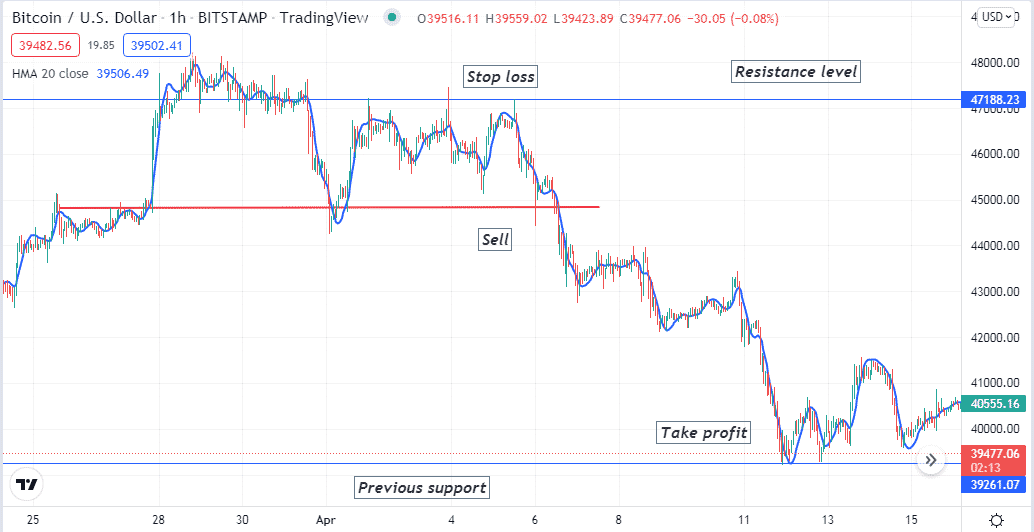
We use the popular support resistance concept in this trading method alongside a Hull moving average of 20 periods. It is a short-term trading strategy, so we recommend using a 15min or H1 chart to seek trade setups. First, mark the basic levels like support resistance, weekly-monthly high/low, historical level, etc., from upper timeframe charts and then seek trading positions in lower time frame charts.
Bullish trade scenario
After applying the HMA (20) line and marking the crucial levels, observe the chart and seek the following conditions:
- The price reaches a support level and finishes a downtrend.
- The price breaks/reaches above short-term resistance.
- The price reaches above the HMA line, and the HMA line starts sloping on the upside.
Bullish setup
Entry
Match these conditions above and place a buy order.
Stop loss
The initial stop loss level will be below the current support level with a buffer of 5-10 pips.
Take profit
The initial profit target will be below the next resistance level. Otherwise, close the buy order when the price drops below the HMA line, and the HMA line starts sloping on the downside.
Bearish trade scenario
After applying the HMA (20) line and marking the crucial levels, observe the chart and seek the following conditions:
- The price reaches a resistance level and finishes an uptrend.
- The price breaks/reaches below short-term support.
- The price reaches below the HMA line, and the HMA line starts sloping on the downside.
Bearish setup
Entry
Match these conditions above and place a sell order.
Stop loss
The initial stop loss level will be above the current resistance level with a buffer of 5-10 pips.
Take profit
The initial profit target will be above the next support level. Otherwise, close the sell order when the price increases above the HMA line and the HMA line starts sloping on the upside.
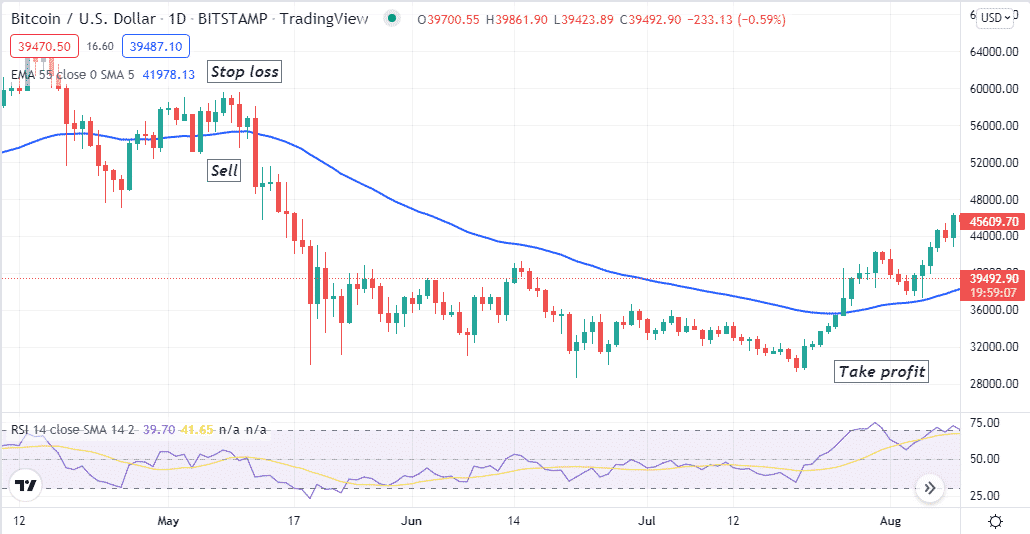
Long-term trading strategy
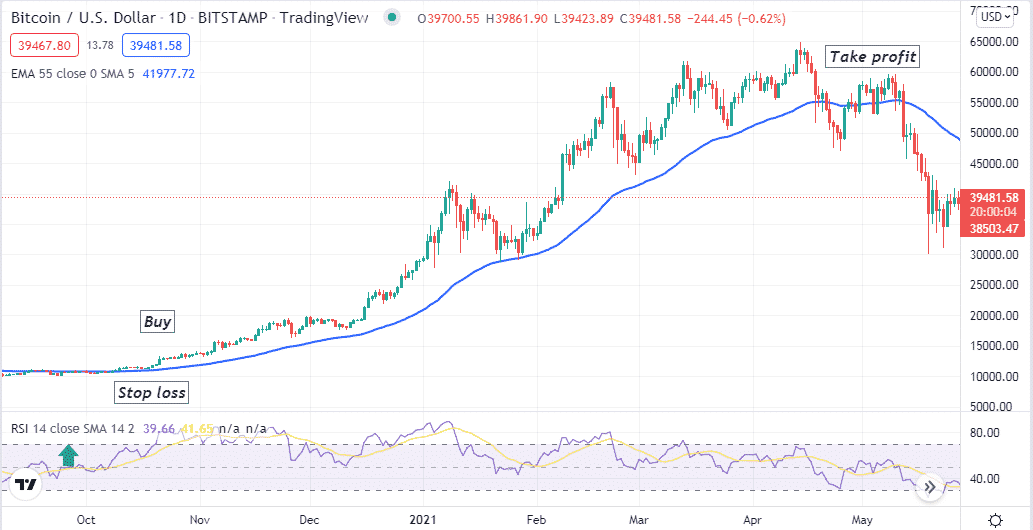
We use an EMA line of 55 periods alongside the RSI indicator in this trading method. This trading method suits many timeframe charts; we recommend using a daily chart to obtain the best results.
Bullish trade scenario
Set those indicators at your target asset chart, then observe indicator readings, such as:
- The price reaches above the EMA line, and the EMA line heads on the upside.
- The RSI dynamic line floats near the central (50) line and heads on the upside.
Bullish setup
Entry
When your chart reflects these conditions, it declares a potential bullish momentum. Open a buy position.
Stop loss
Set an initial stop loss below the current bullish momentum.
Take profit
Close the buy order by observing indicators readings such as:
- The price drops below the EMA line.
- After reaching that level, the RSI dynamic line reaches above the upper (70) level or starts dropping toward the central (50) line.
Bearish trade setup
Set those indicators at your target asset chart, then observe indicator readings, such as:
- The price reaches below the EMA line, and the EMA line heads on the downside.
- The RSI dynamic line floats near the central (50) line and heads on the downside.
Bearish setup
Entry
When your chart reflects these conditions, it declares a potential bearish momentum. Open a sell position.
Stop loss
Set an initial stop loss above the current bearish momentum.
Take profit
Close the sell order by observing indicators readings such as:
- The price rises above the EMA line.
- After reaching that level, the RSI dynamic line reaches below the lower (30) level or starts rising toward the central (50) line.
Pros and cons
| 👍 Pros | 👎 Cons |
|
|
|
|
|
|
Final thought
Richard Dennis was a legendary commodity trader who made millions of dollars by following specific rules. After that, he passed his knowledge and skill to his students (turtles). We only highlight the basic concept; there are still numerous things to know. We suggest some additional research to master the whole idea.


Comments