
When participating in financial trading, you must be familiar with technical indicators. Trading indicators are valuable for financial market participants to obtain more accurate entry/exit positions for trades besides reducing risks on any executing trade. The Chaikin Money Flow indicator is a typical indicator for price action traders.
The following section will discuss the Chaikin Money Flow indicator, a complete guideline to use this computer for successful trading. However, the Chaikin Money Flow indicator involves some complications for traders who still have no idea.
What is the Chaikin Money Flow indicator?
It is a technical indicator that calculates the money flow volume of any specific period. Marc Chaikin is the developer of this technical indicator, and the developing period of this indicator was the 1980s. The standard parameter for this indicator is 20 or 21, which determines the buying or selling pressures on any financial asset during any specific period. When more accumulation takes place, the closing price is nearer to the high, and inversely the closing price remains more relative to the low when more distribution occurs. The CMF indicator uses an independent window to show the market context.
How does the Chaikin Money Flow strategy works
Any trading method that involves using the concept of CMF is a CMF strategy. A straightforward technical indicator suits any trading instrument to create successful trading strategies. It requires following a simple guideline and understanding the working procedure to execute trades through any CMF trading strategy.
Step 1. Identify the market context through CMF indicator
To anticipate the market context, we need to be familiar with the indicator. The CMF indicator window contains a dynamic line and a central (0.0) line. The dynamic line that reaches below the central (0.0) line indicates sufficient declining pressure on the asset price. When distribution takes place, the dynamic line starts to slop downside to declare the declining pressure on the asset price.
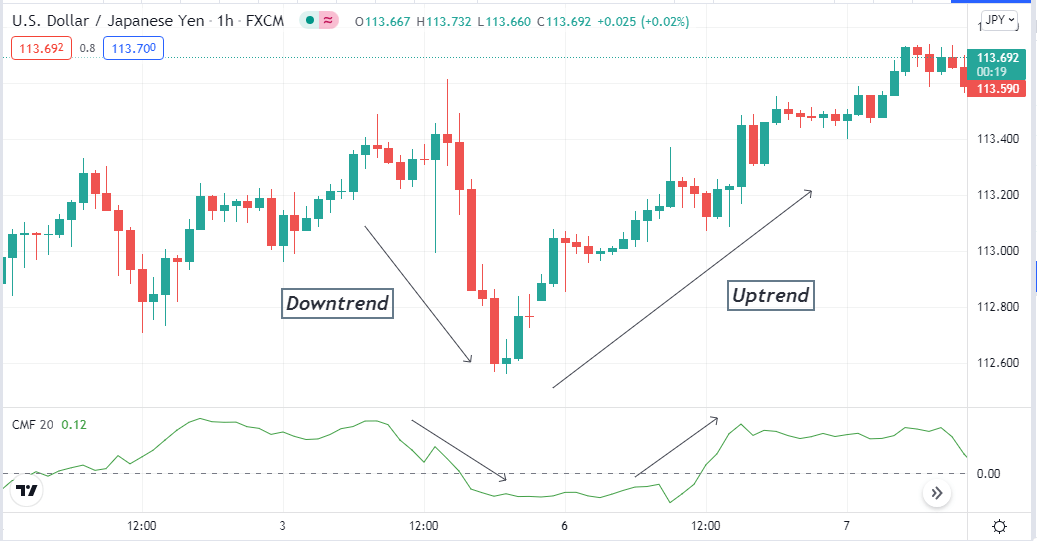
The CMF indicator on a hourly chart of USD/JPY
On the other hand, when the accumulation takes place on the asset price, the dynamic line starts to slop on the upside on this indicator window. The dynamic line reaches above the central (0.0) line, signaling sufficient bullish pressure on the asset price.
The CMF indicator is involved in three types of calculations:
- Money flow multiplier calculating equation
Money flow multiplier = [(Close price – Low price) – (High price – Close price)] / (High – Low)
- Money flow volume equation
Money flow volume = Money flow multiplier x Volume for the period
- Specific period equation
20-Period CMF = 20-Period sum of money flow volume / 20-Period sum of the volume
Step 2. Try combining other indicators data for more accuracy
You can use the Chaikin Money Flow indicator as a stand-alone indicator to generate trade ideas. In that case, you will get poor results that can lead you to make bad trade decisions. So it is better to combine other indicators besides CMF to create successful trading strategies.
You can use the RSI, Parabolic SAR, MACD, MA crossover, ADX, etc., besides CMF to sort entry/exit positions among many trading indicators.
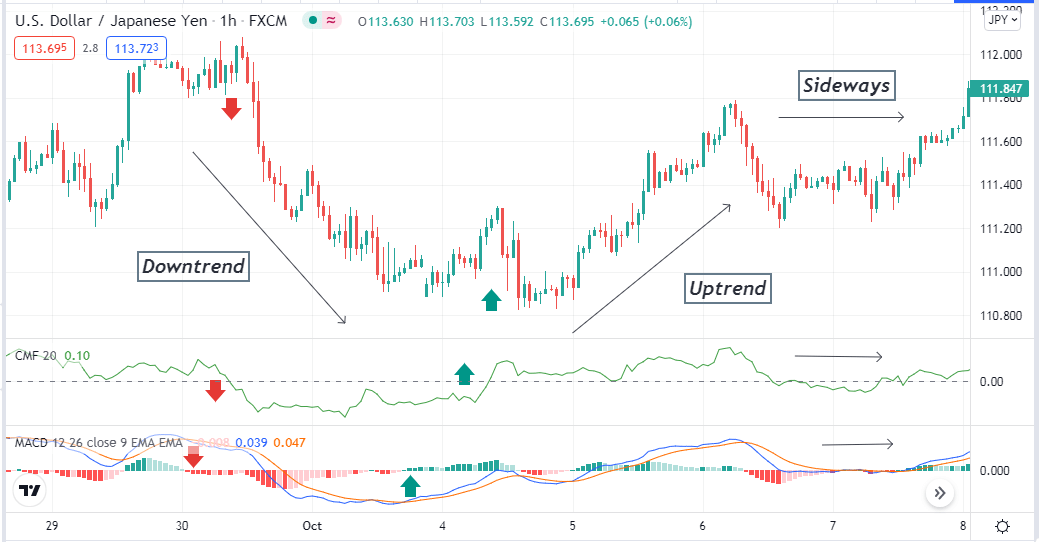
Different phases of market movement
For example, you can use the MACD indicator as a supportive indicator. When the CMF value reaches above the central (0.0) line, check the MACD window. The blue signal line crosses the red signal line on the upside, and MACD green histogram bars above the central line of this indicator declare sufficient bullish pressure on the asset price.
These conditions suggest opening a potentially profitable buy position. Meanwhile, you should seek the opposite appearance on these indicators when executing any sell order.
Step 3. Move to higher time frame charts
Traders depend on time frames to analyze and execute trades when making trade decisions. Choosing time frames depends on several facts such as trade durations, trading method, return expectations, trading asset, capital size, etc. For example, the GBP/JPY remains in a consolidation phase for a few days after making a sharp downward movement.
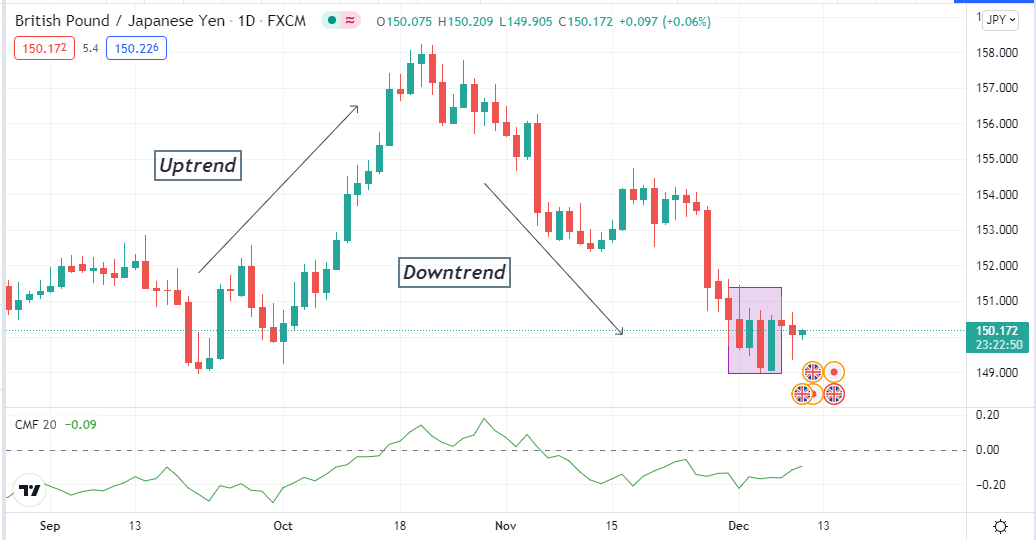
Daily chart of GBP/JPY
In the meantime, this pair creates highs and lows in smaller time frame charts that can create confusion while making trade decisions.
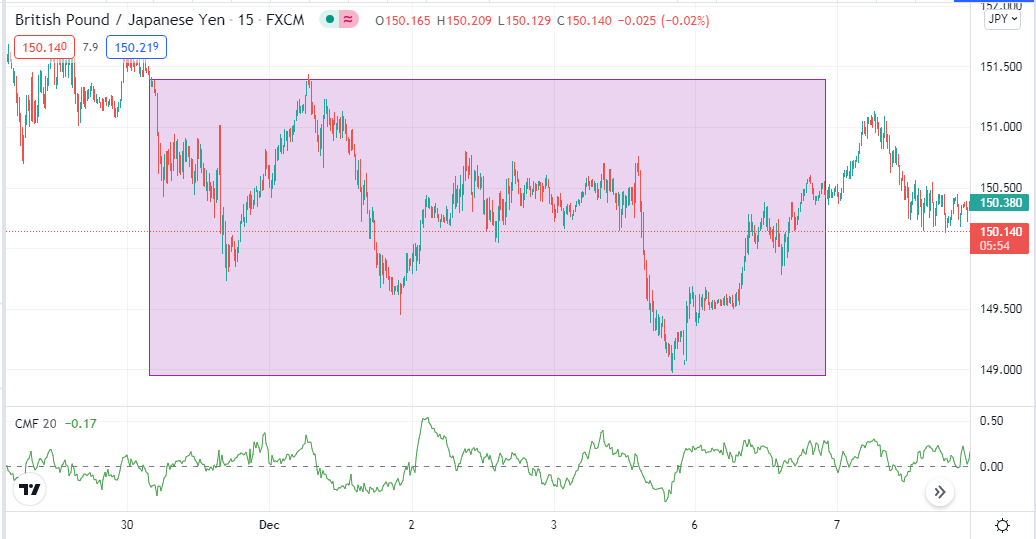
15-min chart of GBP/JPY
So the better way is to follow upper time frame charts, avoid fake swing highs/lows or use multi-time frame analysis for more efficiency on executing trades.
Step 4. Use some fundamental analysis
Many trend-changing fundamental events influence the price movement dramatically in the financial market. Financial traders follow the top three ways to predict future movement:
- Technical analysis
- Fundamental analysis
- Sentiment observation
Any CMF trading strategy will enable you to generate trade ideas depending on the technical market context while ignoring many fundamental facts that affect the price movement.
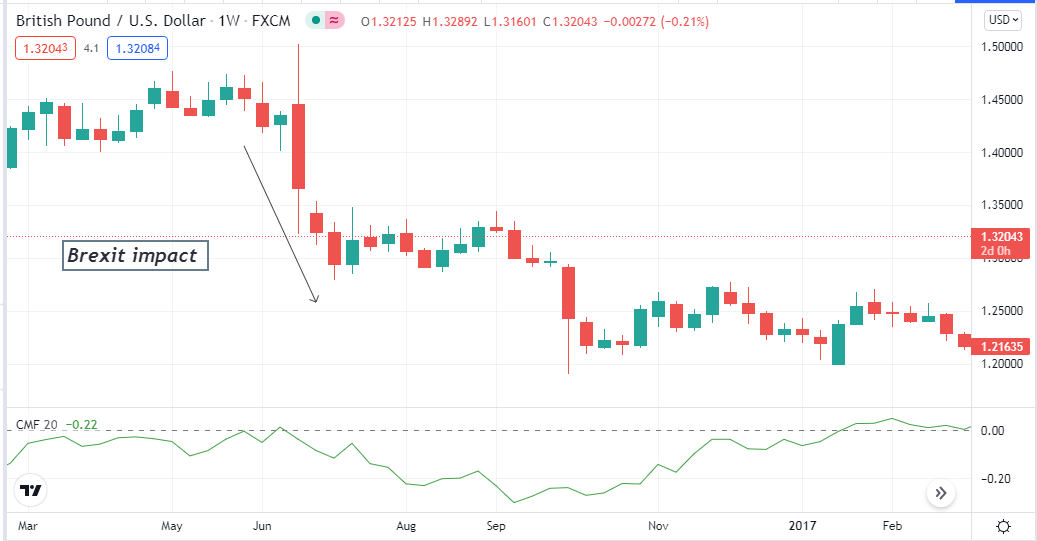
Brexit move on GBP/USD
Many remarkable fundamental events for any currency are interest rate decisions, GDP, Employment data, govt policies/sanctions, etc. For example, Brexit was responsible for the Pound to decline over thousands of pips against many currencies. Keep updated about these data from any reliable source before making trade decisions to increase profitability.
Step 5. Use proper money and trade management
When making a trading strategy, it will suggest you complete trade setups. Specifically, any complete trading strategy will make defining entry/exit points more effortless and more effective. Moreover, trading positions will be more manageable, and the trading approach will contain discipline.
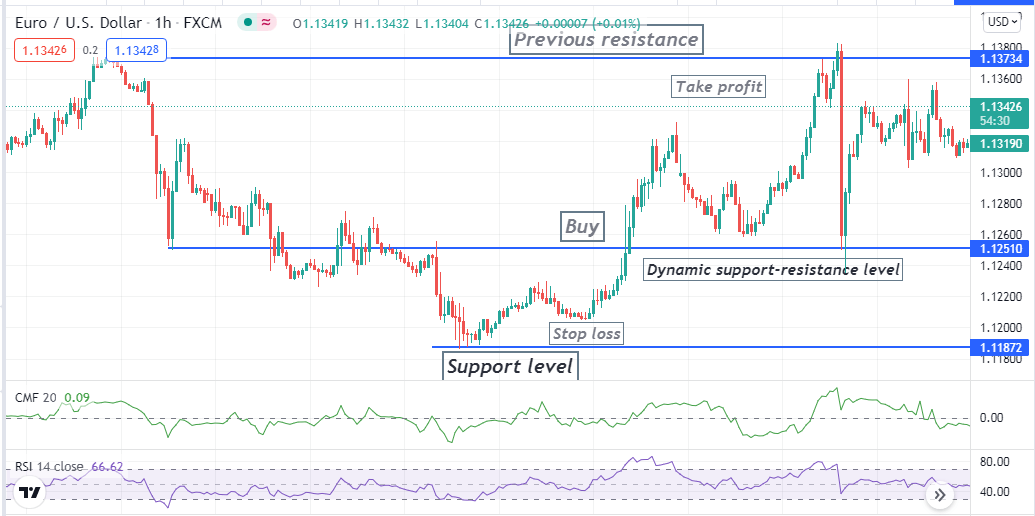
Buy setup using CMF and the RSi indicator
Professional traders take a risk between 2-5% of their capital for executing orders by using stop-loss features. Check the risk-reward and probability of your trade before opening a position. The profit target is different for traders as it depends on several factors, such as trading style, trading technique, trade duration, etc. So remember these factors before making any trading method or executing trades through it.
For example, a daily trader may execute trades with a 1:2 risk-reward ratio. Meanwhile, a swing trader may seek positions with a 1:3 or above risk-reward ratio.
Final thought
The price action traders are smart market participants who execute trades by following institutional sentiments. This indicator CMF allows individual traders to follow that smart money concept to execute trades for any individual trader. If you can use this trading indicator wisely, it can help you to execute constant trading positions and gain thousands of pips every month.


Comments