Camarilla pivot point is a multifaceted indicator created by Nick Scott. The tool is an enhanced formula of the classic pivot point. In terms of calculating numerous levels of support and resistance, it utilizes Fibonacci numbers. It depicts nine price levels in total that traders leverage to point out potential reversal areas.
However, using the Camarilla pivot point, traders spot the key price levels, entry points, exit points, and proper risk management.
There are many available Camarilla strategies for trading in any financial market. But the best one relies on the market condition of a particular time since market conditions will command the best-suited strategy.
What is the Camarilla pivot?
It enhances the classic pivot point that traders utilize to identify the key levels of support and resistance. Camarilla pivot comprises four support and four resistance levels and significantly closer levels than other pivot variations, making the indicator ultimate for crypto traders.
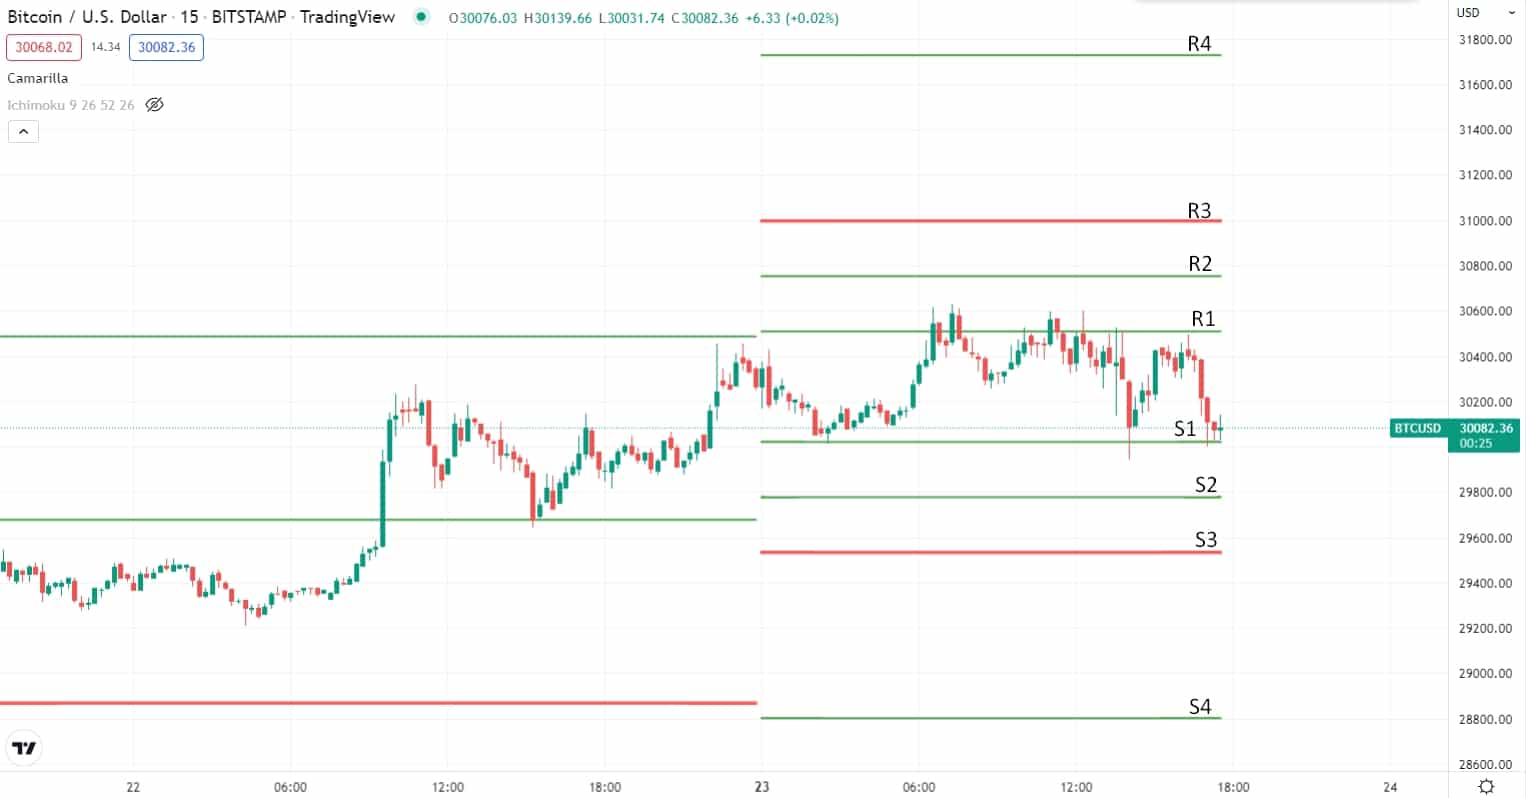
Camarilla on chart
How to trade?
This is one type of technical indicator used for spotting the price levels. It also helps market participants point out the ideal entry and exit points of the market. The indicator is also able to generate very versatile data. However, it can be applied combined with strategies such as risk management.
On the other hand, traders may apply the Camarilla strategy alone according to their trading objectives. It is important to remember that the market conditions within a given time frame always manipulate the indicator regardless of your planning to apply it. Consequently, various significant forms are available in this trading strategy that traders may exploit, relying on their needs.
A short-term trading strategy
It has been built based on the market price action context. This trading method will look at the pivot level S3 and R3 to identify trades.
- For instance, when the price breaks above the pivot level S3 or bounces back from it. It indicates a buy signal.
- On the contrary, when the price breaks below the pivot level R3 or rejects from it. It indicates a sell signal.
However, we will apply this trading strategy to the M5 and M15 time frames.
Bullish trade scenario
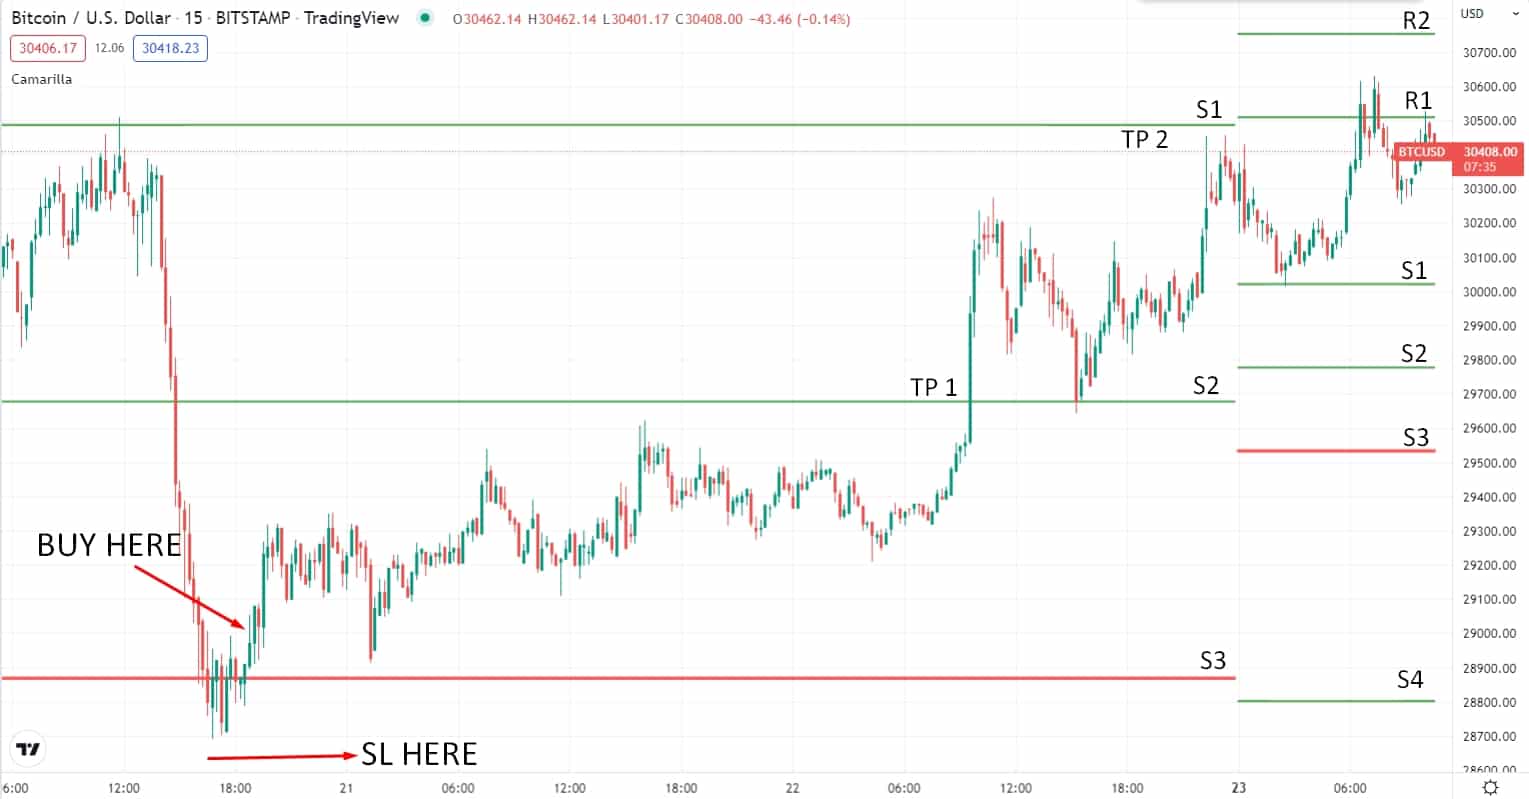
Short-term bullish trade scenario
Entry
Look for the price to close above the S3 level after an impulsive breakout or a strong bounce. Enter a buy trade when the price breaks above the last swing high with a bullish candle.
Stop-loss
Place the stop loss order below the last swing level or below the S3 pivot level with at least a 5-10 pips buffer.
Take profit
Take the profit by calculating at least a 1:3 risk/reward ratio. Or else, you can target the upcoming pivot resistance levels to take the profit.
Bearish trade scenario
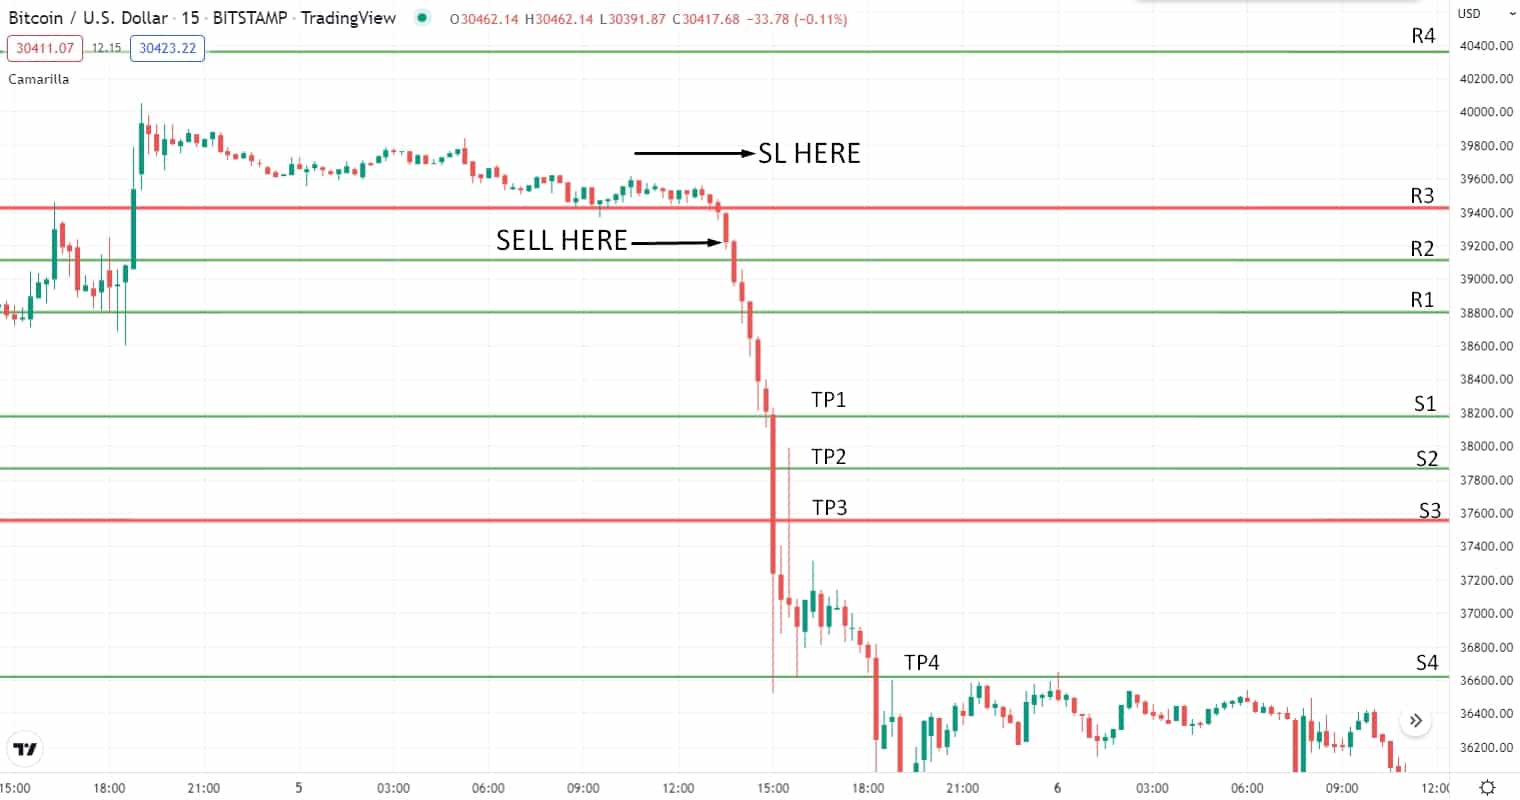
Short-term bearish trade scenario
Entry
Look for the price to close below the R3 level after an impulsive breakout or a strong rejection. Enter a sell trade when the price breaks below the last swing low with a bearish candle.
Stop-loss
Place the stop-loss order above the last swing level or above the R3 pivot level with at least a 5 – 10 pips buffer.
Take profit
Take the profit by calculating at least a 1:3 risk/reward ratio. Or else, you can target the upcoming pivot support levels to take the profit.
A long-term trading strategy
It has developed based on the market trend in the higher time frames. This Camarilla crypto trading strategy is a very profitable trading method as it is based on the market’s ongoing trend. This trading system is totally based on the market context. So, you do not need to add other trading indicators to the chart. Moreover, this crypto trading strategy we will apply to the H4 and D1 time frames.
Bullish trade scenario
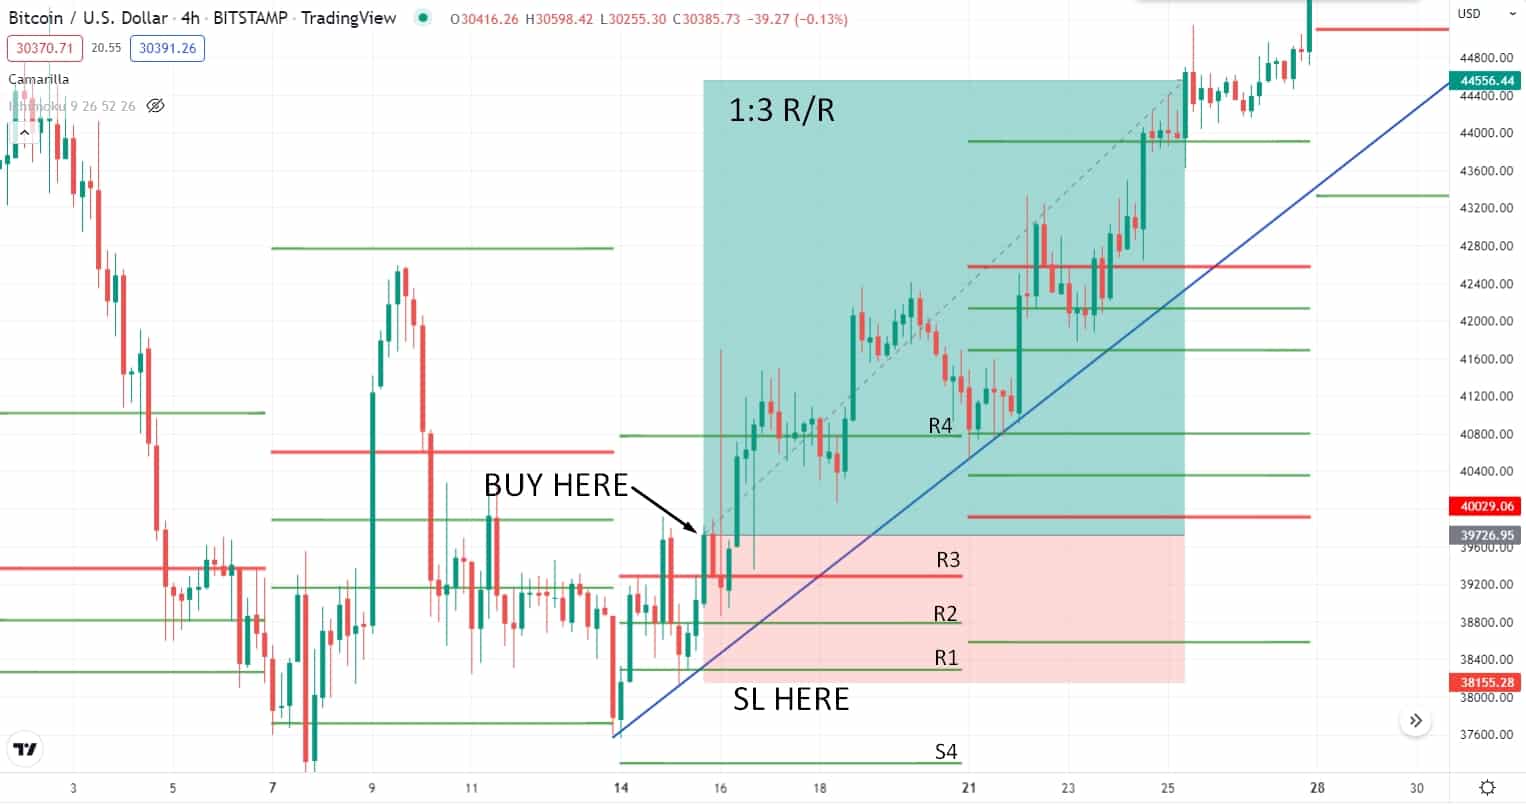
Long-term bullish trade scenario
Entry
Look for a buy trade when the price bounces from the bullish trend line and breaks above the pivot level R3 with an impulsive bullish candle.
Stop-loss
Place the stop loss order below the bullish trend line with at least a 10-15 pips buffer. Otherwise, you can put the stop loss order below the R2 level to minimize some risk.
Take profit
You can take the profit by calculating at least a 1:3 risk/reward ratio. Or else, you can ride the trend until the next resistance level arrives.
Bearish trade scenario
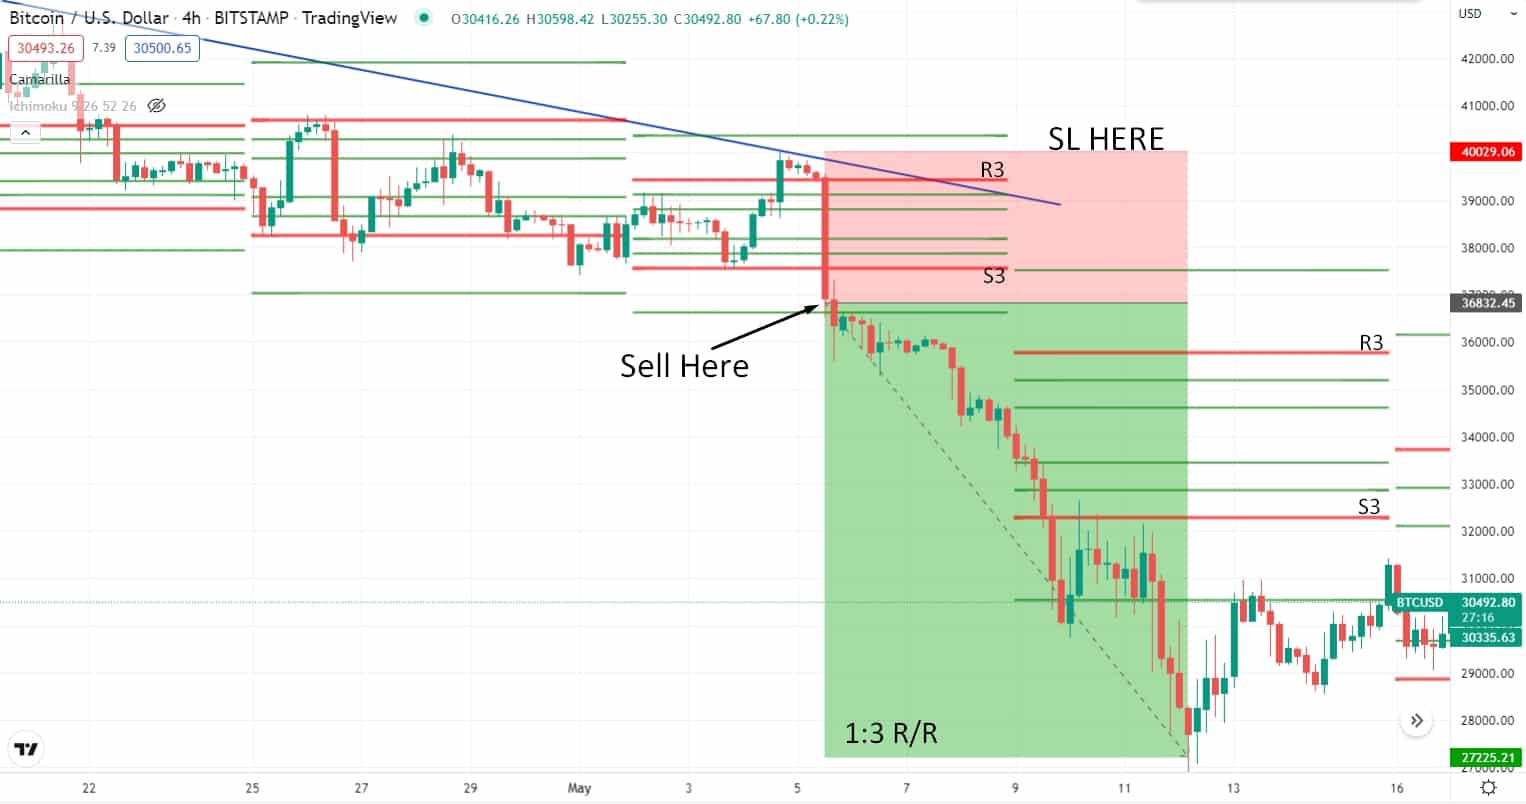
Long-term bearish trade scenario
Entry
Look for a sell trade when the price rejects from the bearish trend line and breaks below the pivot level S3 with an impulsive bearish candle.
Stop-loss
Place the stop loss order above the bearish trend line with at least a 10-15 pips buffer. Otherwise, you can put the stop-loss order above the S4 level to minimize some risk.
Take profit
You can take the profit by calculating at least a 1:3 risk/reward ratio. Or else, you can ride the trend until the next support level arrives.
Pros & cons
| 👍 Pros | 👎Cons |
|
|
|
|
|
|
Final thoughts
Finally, applying this strategy will surely provide some advantages for crypto traders. The indicator identifies the price levels and spots the potential tendency of reversal. In finding the perfect entry and exit points in the market, pivot points benefit traders. Moreover, traders may help place the stop-loss orders and limit orders appropriately through pivot points.


Comments