
The Bladerunner strategy is a unique trading method, which many market participants choose for positive results. This method uses the core concept of technical analysis, where applying a good risk management system is easy. Moreover, the profitability of this method is high where some conditions are applicable like practice and understanding of the trading tool.
Besides, it is mandatory to understand the method besides the implementation procedure to achieve the best results. In this article, we will explain the Bladerunner forex strategy. Moreover, we will use this concept to describe long-term and short-term trading strategies.
What is the Bladerunner forex strategy?
It is a unique and easily applicable trading method that applies to any trading instrument at any time frame. This trading method uses an exponential moving average (EMA) of 20 periods to determine trading positions.
The concept is simple:
- When the price remains above the EMA line, it declares a bullish bias and a bearish bias when the price remains below the EMA line.
- When the price remains above the EMA line, drops and tests the EMA line, and bounces back to the upside, traders seek to place buy orders.
On the other hand, this method enables sell opportunities when it remains below the EMA line and declines after testing the EMA line. The strategy calls Bladerunner by its nature as it “Cuts” the price whenever the price reaches the EMA line.
How to trade using the Bladerunner strategy?
This method contains only one indicator, the EMA-20. Traders use it to seek potential trading positions by following two momentums:
- First, the price must have a breakout above or below the EMA line and remains that way for a particular period.
- Second, the price must retest the EMA line and reject a breakout.
The first candle is bullish. When the price comes back to the EMA line and rejects having a breakout, traders usually follow the candle formation for more confirmation. For example, test the EMA line and start bouncing back to the upside if the price is above the EMA line. Meanwhile, if the next candle is also declaring bullish pressure on the asset price, the bullish momentum remains intact, and it is a suitable place to open a buy position.
A short-term trading strategy
We already know this trading method uses only an EMA-20 line to generate trade ideas. So first, set the indicator at your target asset chart. It can be any trading instrument with sufficient volatility and tendencies to remain on a trend for a while. We recommend using a 15-min chart to generate short-term trading ideas. Meanwhile, confirm the trend from upper timeframe charts such as H4 or daily charts.
Bullish trade scenario
First, confirm the current trend is bullish from upper timeframe charts and seek to open a buy position when:
- The price crosses and remains above the EMA line.
- The price declines to the EMA line but does not break below, or the support remains intact.
- The price starts to move on the upside after touching the EMA line.
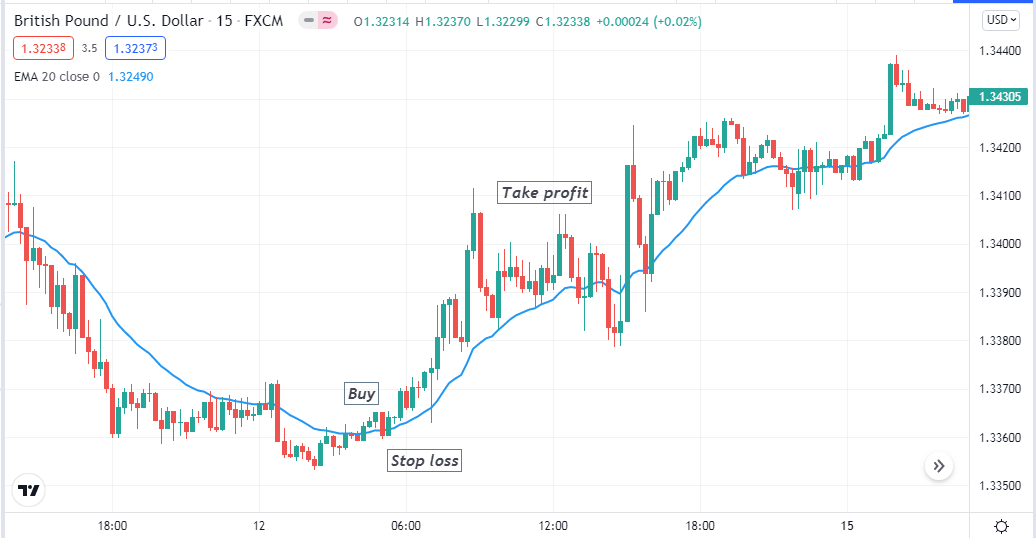
Bullish setup
Entry
After these scenarios occur on your target asset chart, wait till the current bullish candle finishes formation and place a buy order.
Stop loss
The reasonable stop loss will be below the EMA line where the bullish momentum starts.
Take profit
Continue the buy trade as long as the price remains on the uptrend. Close the buy position when the price comes below the EMA line.
Bearish trade scenario
First, confirm the current trend is bearish from upper time frame charts and seek to open a sell position when:
- The price crosses and remains below the EMA line.
- The price bounces to the EMA line but does not break above, or the resistance remains intact.
- The price starts to move on the downside after touching the EMA line.
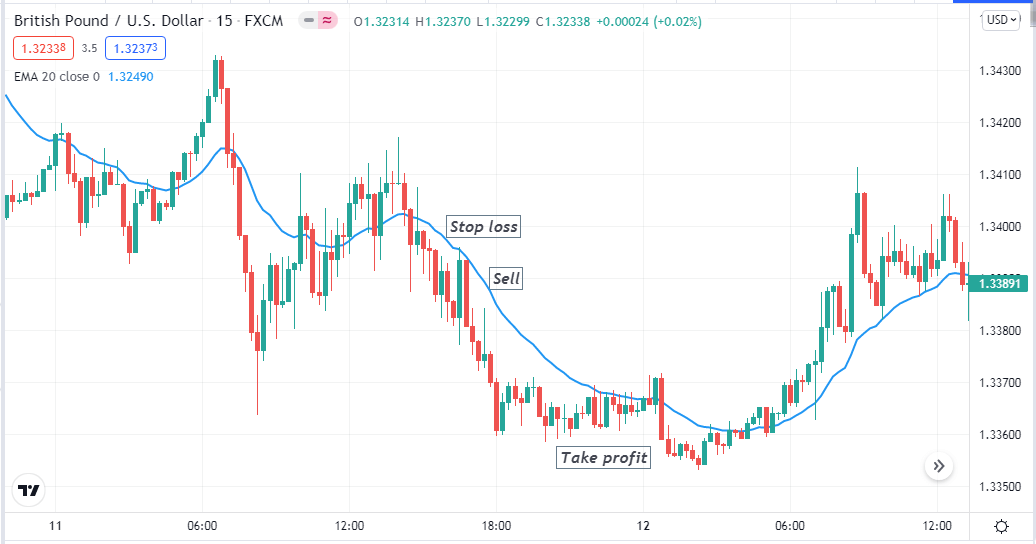
Bearish setup
Entry
After these scenarios occur on your target asset chart, wait till the current bearish candle finishes formation and place a sell order.
Stop loss
The reasonable stop loss will be above the EMA line, where the bearish momentum starts.
Take profit
Continue the sell trade as long as the price remains on the downtrend. Close the sell position when the price comes above the EMA line.
A long-term trading strategy
This trading method uses support resistance and historical levels alongside the EMA-20 line to seek potential long-term trading positions. The concept is to place buy/sell orders when any breakout occurs, suits any trading asset, and the recommendable timeframe is the daily chart to execute long-term trades.
Bullish trade scenario
Seek to open a buy position when:
- The price breaks above any dynamic support resistance level.
- The price remains above the EMA line.
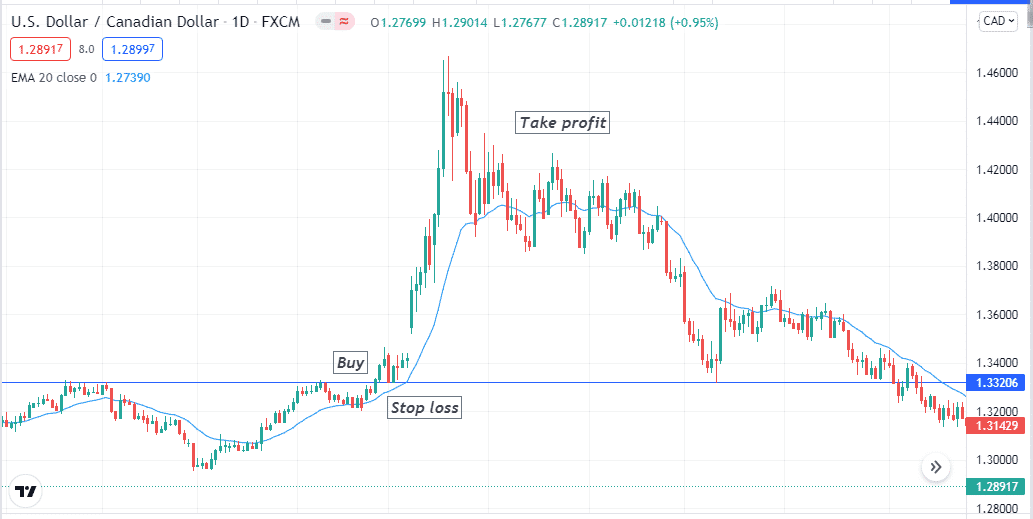
Bullish setup
Entry
When these conditions above match your target asset chart, place a buy order.
Stop loss
The reasonable stop loss level will be below the dynamic support resistance level.
Take profit
Close the buy position when the price comes below the EMA line by declining.
Bearish trade scenario
Seek to open a sell position when:
- The price breaks below any dynamic support resistance level.
- The price remains below the EMA line.
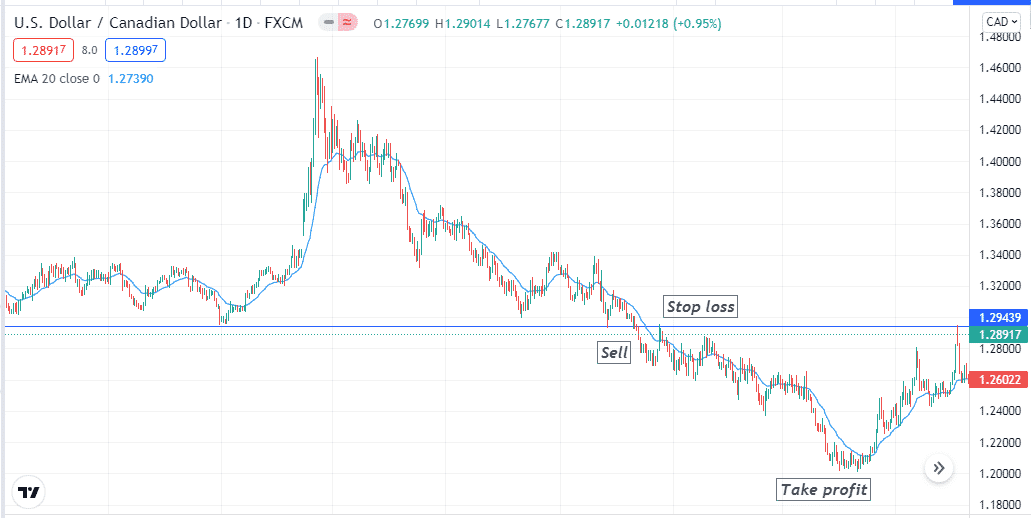
Bearish setup
Entry
When these conditions above match your target asset chart, place a sell order.
Stop loss
The reasonable stop loss level will be above the dynamic support resistance level.
Take profit
Close the sell position when the price comes above the EMA line by bullish pressure.
Pros and cons of the strategy
| 👍 Pros | 👎 Cons |
|
|
|
|
|
|
Final thought
The Bladerunner trading method is very potent when you use it wisely. We suggest following reliable sources to obtain fundamental data about your target currency pairs and avoid trading with this method during trend-changing events such as GDP, employment info, central bank policy, interest rate, etc. Besides, you should use a good risk management system to avoid unexpected market behavior.


Comments