Are you a new trader figuring out how you can start trading in the foreign exchange market? If so, then you have come to the right place. This article will learn about the most popular currency pair among traders and why it has earned that reputation.
The euro/dollar (EUR/USD) is the most heavily traded asset in the FX. This financial asset is composed of two currencies (i.e., euro € and dollar $). That is why it is called a currency pair. The pair is famous among traders as the individual currencies constitute the two biggest economies in the world.
What the euro & dollar trader should know
The EUR/USD pair is traded as one financial instrument. Traders can either buy or sell the currency pair depending on their perception of its direction in the immediate future. The value or price of EUR/USD is given as a number that represents the relative strength between the euro and dollar. This value constantly moves up and down throughout the day for five days a week.
You can see the EUR/USD in action by opening a chart in a trading platform such as MetaTrader, TradingView, WebTrader, etc. You can download and install mobile versions of these platforms as well for easy access to the chart.
The EUR/USD pair in particular and the currency market, in general, are closed during weekends. This is usually the case most of the time. Apart from the weekends, the FX is also closed during essential holidays such as New Year’s Day.
Major economic indicators
Trading the EUR/USD pair often involves monitoring economic events that can affect its price movement. The importance of news events varies by their ability or inability to move prices sharply in any direction. News releases belong to one of three categories:
- low impact
- medium impact
- high impact
EUR/USD traders closely watch the following major economic releases to get clues on the potential direction of the financial asset:
-
Interest rates
The single most crucial economic indicator affecting the rate of EUR/USD is the interest rate. The two central authorities releasing interest rate figures are the Federal Reserve (Fed) for the US dollar and the European Central Bank (ECB) for the euro. While the ECB publishes the interest rate monthly, the Fed makes such an announcement eight times each year.
-
Employment numbers
The next most important economic indicator for EUR/USD is the employment numbers. Employment is a critical factor that determines the health of an economy. Therefore, the non-farm payroll (NFP) is the most crucial employment statistic that traders want to get hold of every month as it has a massive bearing on the potential direction of the EUR/USD market.
Other economic indicators can affect the exchange rate of EUR/USD to some extent.
These economic releases include the following:
- Gross domestic product
- Trade balance
- Retail sales
- Consumer price index
- Producer price index
- Sentiment indicators
Top 3 practical strategies for the euro/dollar trader
You can trade the GBP/USD pair in various ways. However, for new traders, you must use simple strategies at first. In the succeeding sections, you will find three simple strategies to trade the GBP/USD market. Learn these strategies and apply your knowledge in the market by dealing with a demo account.
Strategy №1: Buy/sell the pullback
The EUR/USD can trend either direction, up or down, with relatively the same amount of power. A strong trend can take prices from one level to the next, creating opportunities for trend traders to make big money.
It is not uncommon for the EUR/USD pair to trend strongly without making significant corrections. While you can take advantage of this opportunity by joining the herd once the trend is clear, the length of the move is rather difficult to determine with some degree of certainty. Frequently, traders enter the market at the very last stage of the movement, causing them to exit the trade at a loss.
To avoid falling into this trap, you can use the pullback strategy. With this strategy, you can:
- Buy the pullback if the pair trends upward
- Sell the pullback when the pair trends downward
Your aim is not to jump into the trade at the start of the trend move. Instead, you patiently wait on the sidelines until the current trend loses momentum and begins to move in the opposite direction. What you want to see next is a sign that the pair is ready to continue the initial trend.
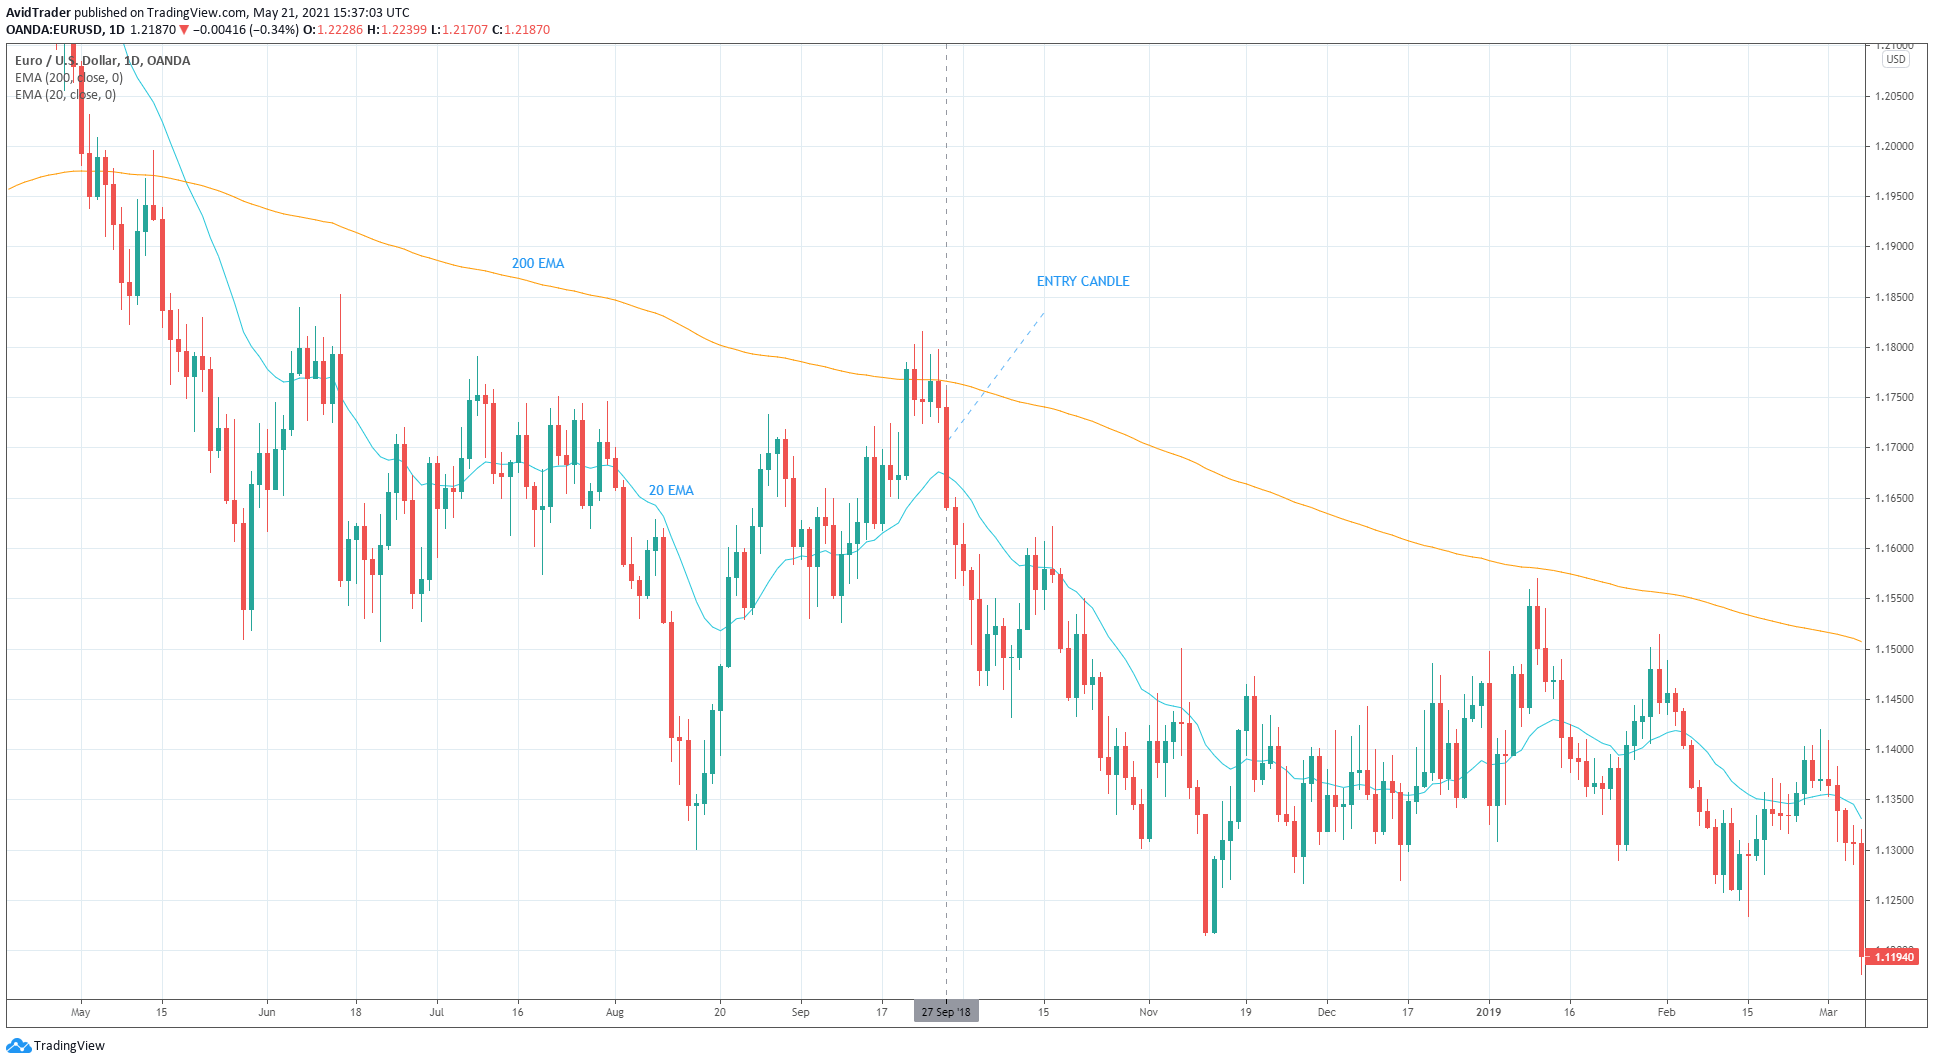
You can use several techniques to determine if the EUR/USD pair is ready to trend again. One such method involves the use of two moving averages with different periods. A sample trade entry is shown in the image above to help you understand how this technique works.
The slope of the 200 EMA defines the trend direction:
- Since the 200 EMA is sloping down, the trend is bearish, and you would be looking for a sell entry.
- The entry comes when the pair makes a pullback, and then the price breaks and closes below the 20 EMA. Thus, you can take a sell trade after the entry candle closes.
Strategy №2: Buy/sell the breakdown
The second strategy involves taking trades after the market gets out of a trading range. In general, the currency market spends about 80 percent of its time in ranging conditions and only about 20 percent of the time in trending conditions. Therefore, you must know how to trade in both situations to become a versatile trader.
When the price action is contained between clearly defined upper and lower boundaries for an extended period, it creates another trade opportunity that you can take advantage of.
In this situation, traders expect that price will eventually come out of the range to start a new trend. You do not need to know the direction of the breakout. Price can break above resistance or below support, and you are going to join the breakthrough.
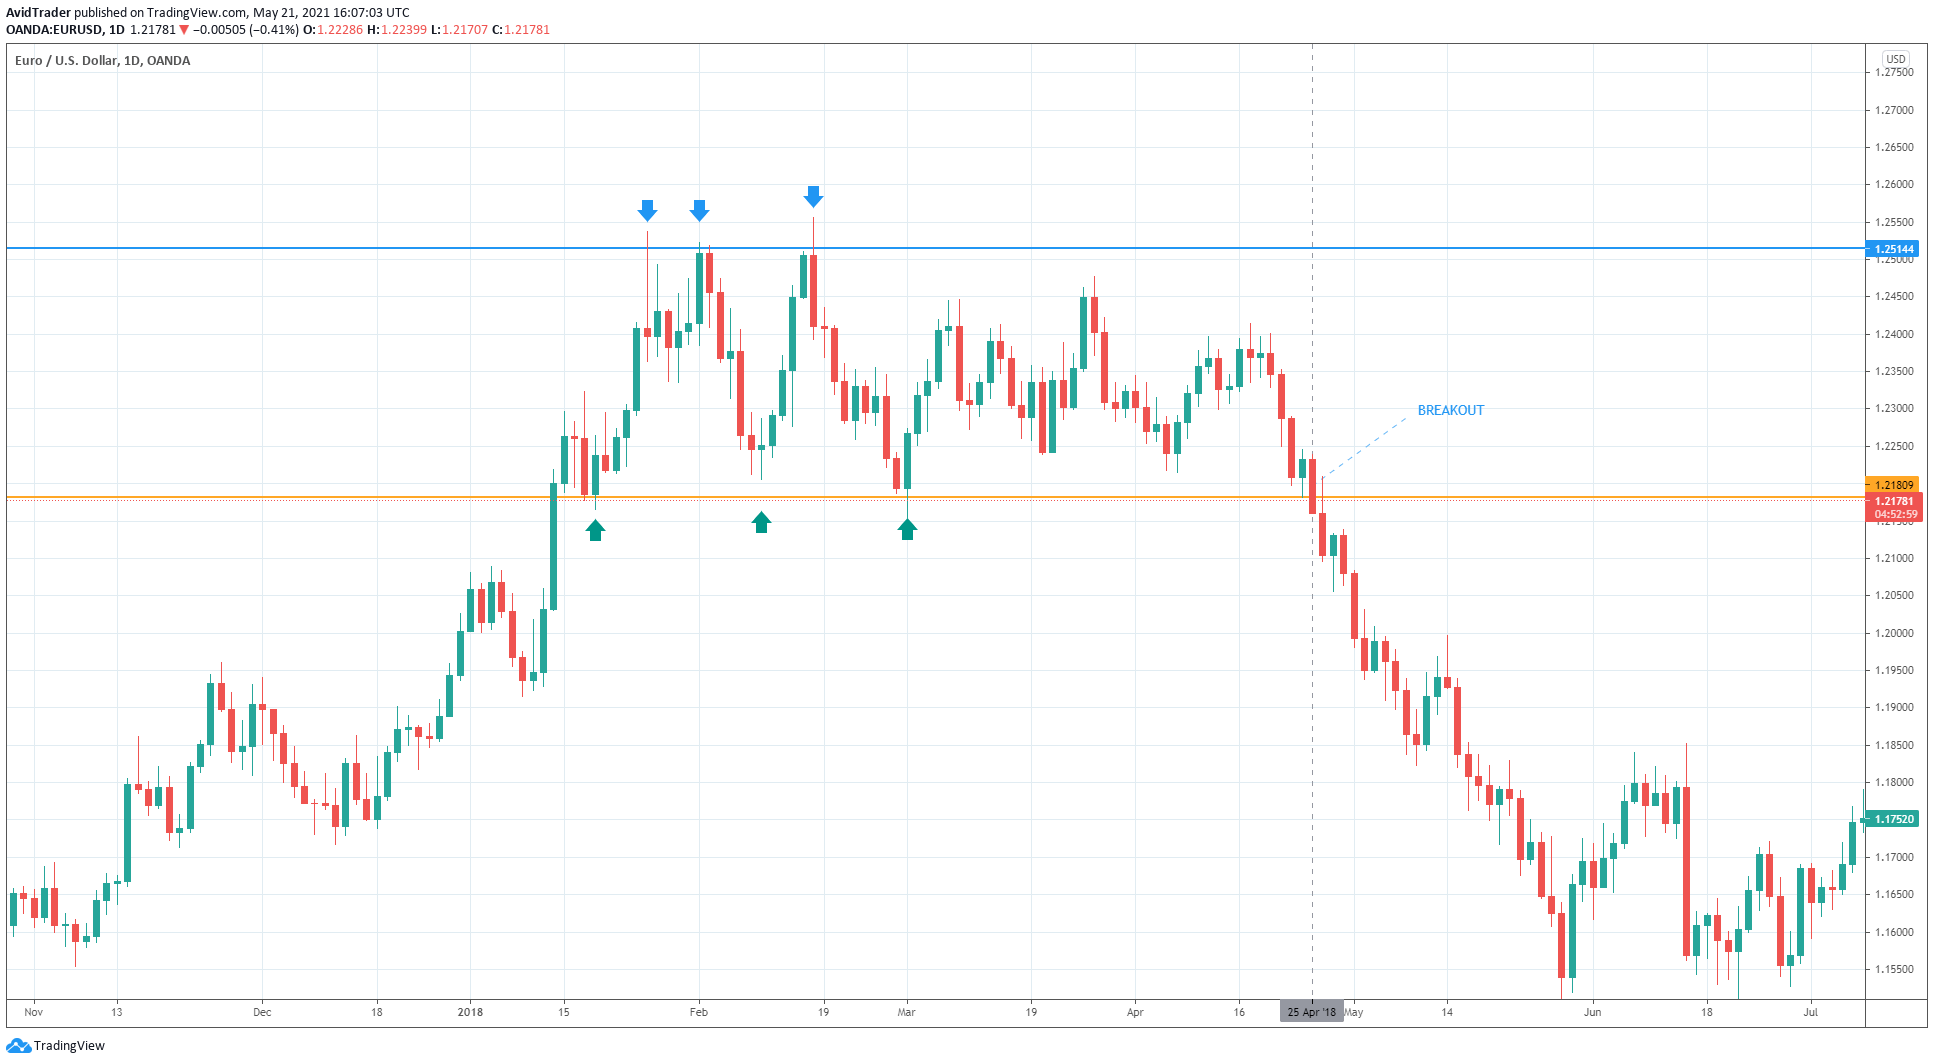
To avoid false breakouts, you must wait for the price to break and close beyond support or resistance and then trade accordingly. The image above shows a sample trade setup.
As you can see, EUR/USD traded in a range of around four months from 12 January 2018 to 25 April 2018. Price consolidated in a tighter range before the eventual breakout:
- As long as the price remains above support around 1.2180 and below resistance around 1.2510, the market is ranging.
- The sell entry came on 25 April 2018 when a big bearish candle broke and closed below support. A strong sell-off ensued after the breakout.
Strategy №3: Narrow range patterns
The third strategy utilizes the narrow range pattern. As a price action strategy, it does not require the use of technical indicators. What you need to trade this strategy are your eyes. While this strategy may work in any timeframe, the best timeframe to use is a daily chart.
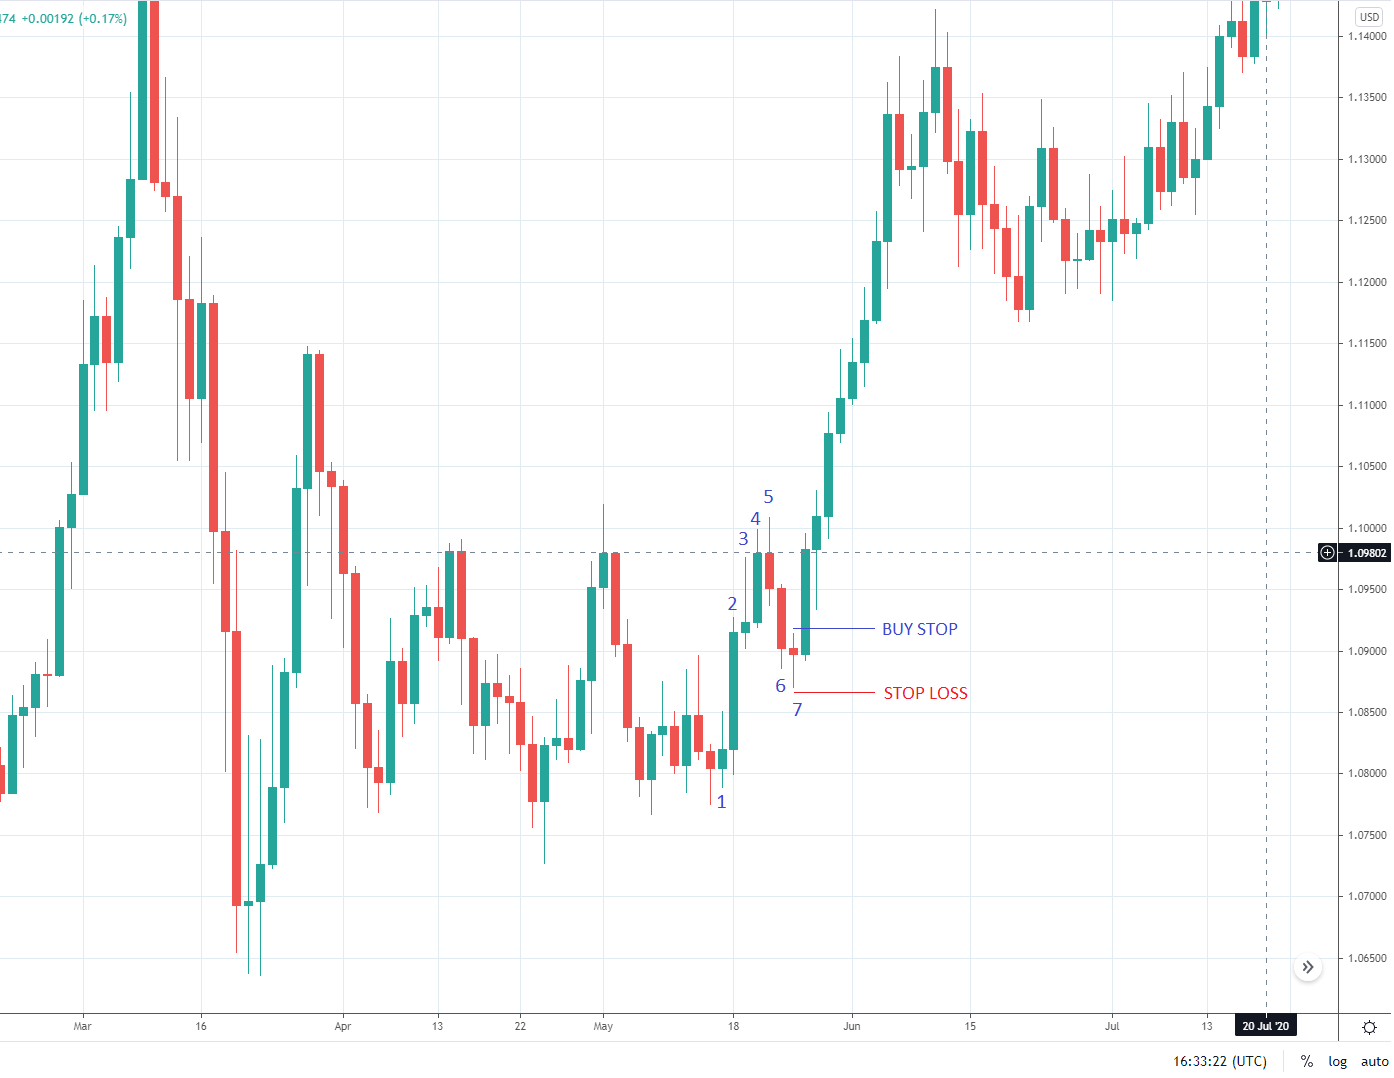
The narrow range pattern needs seven candles to form. If the seventh candle has the smallest range compared to the previous six candles, you have a narrow range pattern. It is best if the pattern forms on or near support or resistance. By definition, the actual location where it is created is not a requirement.
Finding the narrow range pattern on the EUR/USD chart is often not an easy task. To find one, you must look for a candle with a small range and then count backward. The candle range refers to the distance between the high and the candle’s low, typically in pips.
After you locate such a pattern, you are ready to enter the trade.
|
If the trend is generally bearish, then place: |
If the trend is generally bullish, then place: |
|
|
Consider the sample trade below.
Final thoughts
Trading the financial markets is not easy, and this is particularly true for the foreign exchange market. However, if you have a solid resolve to learn the trade and succeed in this business, you have to start right. This involves finding one or two pairs to focus on and then using one or two simple strategies.
The strategies presented in this article are straightforward, but if you use their principles and improve on them, you might develop a fine-tuned trading system that will serve you well in your trading journey.


Comments