
MYC trading indicator is a private technical indicator that combines different market measurements to obtain the market context. This indicator helps generate trade ideas in crypto assets. The unique feature of combining additional market data makes this indicator attractive to many crypto investors.
However, without having a clear concept, it is not wise to start using any technical indicator. When you know the components and master the idea of any specific indicator enables using that indicator more efficiently. This article will dive down into the MYC trading indicator and sustainable trading strategies using this technical indicator.
What is the MYC trading indicator?
It is a unique indicator that combines momentum oscillator and trend analysis to determine the price direction. Combining both info enables identifying more precise trading positions. Crypto investors can determine the trend and ride the trend to enjoy maximum profit from any particular movement.
Moreover, the momentum indicator helps determine the trend switching points so that traders can participate in more accurate trades. This private custom-made indicator combines the RSI and the stochastic oscillator concept in an independent window to generate trade ideas.
How to trade using the MYC indicator in crypto trading?
Crypto investors can use the concept of the MYC indicator to generate constantly profitable trade ideas. This indicator results in an independent window containing two dynamic lines (ash and green) representing stochastic oscillator reading and the other two (black and yellow) representing the RSI indicator reading. All these dynamic lines float between a range of 0-100. The green and the blue stochastic dynamic lines can reach beyond the range of 20-80, and the RSI dynamic lines (black and yellow) only float between the range of 20-80.
Short-term trading strategy
We use the MYC indicator independently to catch the most profitable trades in this short-term trading method. We recommend using a 15min or hourly chart to obtain the best results. In this trading strategy, first, we confirm the momentum and then check the trend direction from dynamic RSI line readings. We suggest while using this method, it is better to check upper time frame charts before executing any trades to participate in the most accurate trades.
Bullish trade scenario
When seeking to open buy positions, set the indicator at your preferable indicator chart and observe readings as below:
- The dynamic green line reaches above the dynamic red line near the bottom (20) level.
- Both dynamic oscillator lines head toward the upside.
- The black RSI line is above the yellow line and near 50% of the range.
- Both the black and yellow lines slop on the upside.
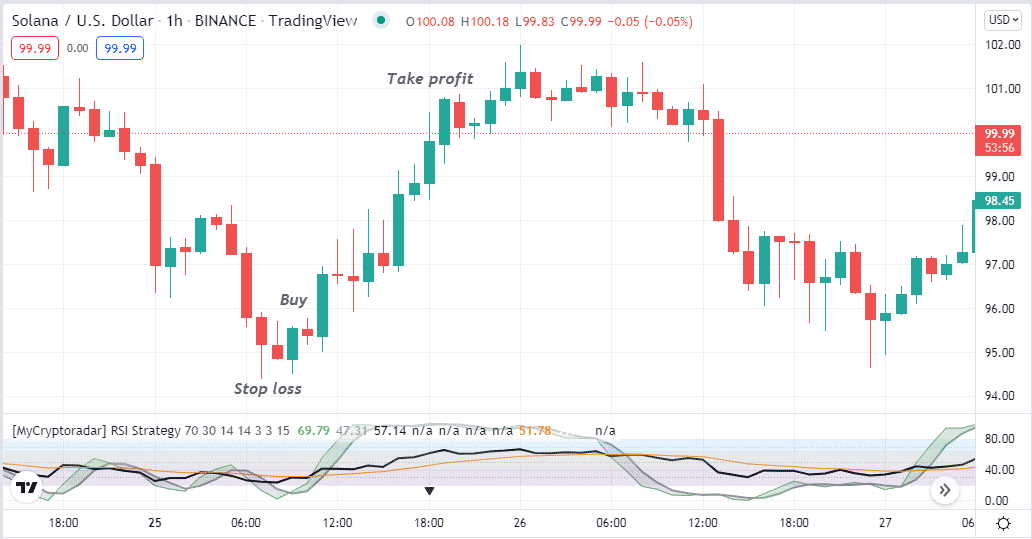
Bullish setup
Entry
When these conditions above match your target asset chart, it indicates the price may enter a bullish trend. Open a buy position.
Stop loss
The initial stop loss level will be below the current bullish momentum with a buffer of 10-12 pips. You can shift your stop loss above or at the breakeven point if you continue your buy order after the price creates a new higher high.
Take profit
Continue the buy order till the price remains on the uptrend. Close the position by checking the conditions below:
- The green and the blue oscillator dynamic lines reach above the upper (80) level.
- After getting above, both dynamic oscillator lines decline below the top (80) level.
Bearish trade scenario
When seeking to open sell positions, set the indicator at your preferable indicator chart and observe readings as below:
- The dynamic green line reaches below the dynamic red line near the top (80) level.
- Both dynamic oscillator lines head toward the downside.
- The Black RSI line is below the yellow line and near 50% of the range.
- Both the black and yellow lines slop on the downside.
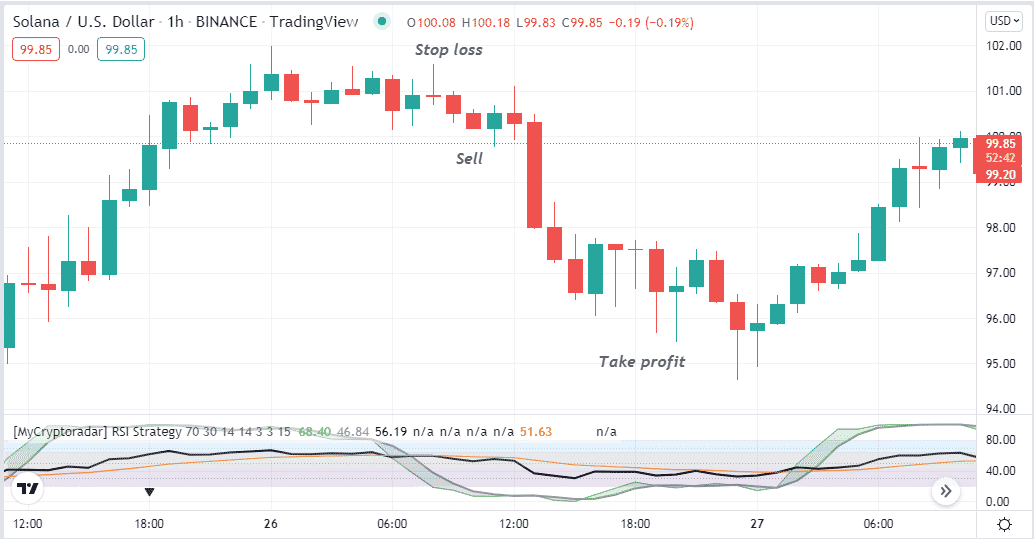
Bearish setup
Entry
When these conditions above match your target asset chart, it indicates the price may enter a bullish trend. Open a sell position.
Stop loss
The initial stop loss level will be above the current bearish momentum with a buffer of 10-12 pips. You can shift your stop loss below or at the breakeven point if you continue your sell order after the price creates a new lower low.
Take profit
Continue the sell order till the price remains on the uptrend. Close the position by checking the conditions below:
- The green and the blue oscillator dynamic lines reach below the lower (80) level.
- After getting below, both dynamic oscillator lines increase above the bottom (20) level.
Long-term trading strategy
We use the Parabolic SAR as a supportive indicator alongside the MYC indicator to identify precious trading positions in this trading method. We combine the Parabolic SAR and the MYC indicator readings to generate trade ideas. You can apply this method to many time frame charts; the preferable charts to catch long-term trades are H4 and D1.
Bullish trade scenario
This method suggests opening buy trades when the scenarios below occur:
- The bullish crossover (green above the blue) occurs between the dynamic oscillator lines near the bottom (20) level of the MYC indicator window.
- The dynamic black line is near 50% of the range and slope on the upside.
- Parabolic SAR dots take place below price candles and start to make a series.
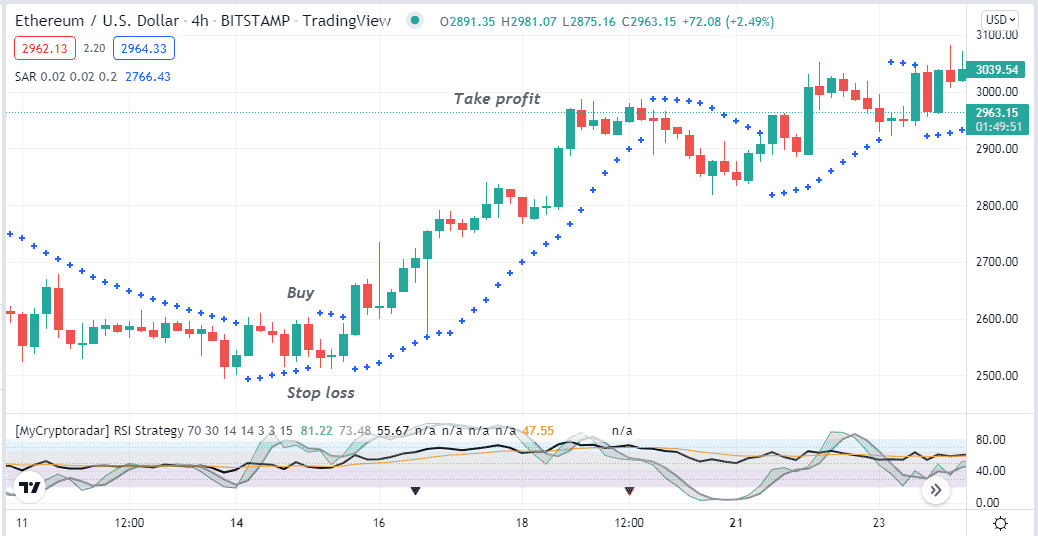
Bullish setup
Entry
These conditions above confirm the bullish momentum and suggest opening a buy position.
Stop loss
Set an initial stop loss below the current bullish momentum.
Take profit
Your buy position remains safe till the bullish momentum remains intact. Close the buy order by checking the conditions below:
- A bearish crossover occurs between the dynamic oscillator lines in the MYC indicator window near the upper (80) level.
- The dynamic black line starts sloping on the downside.
- Parabolic SAR dots switches on the upside of price candles.
Bearish trade scenario
This method suggests opening sell trades when the scenarios below occur:
- The bullish crossover (green below the blue) occurs between the dynamic oscillator lines near the upper (80) level of the MYC indicator window.
- The dynamic black line is near 50% of the range and slope on the downside.
- Parabolic SAR dots take place above price candles and start to make a series.
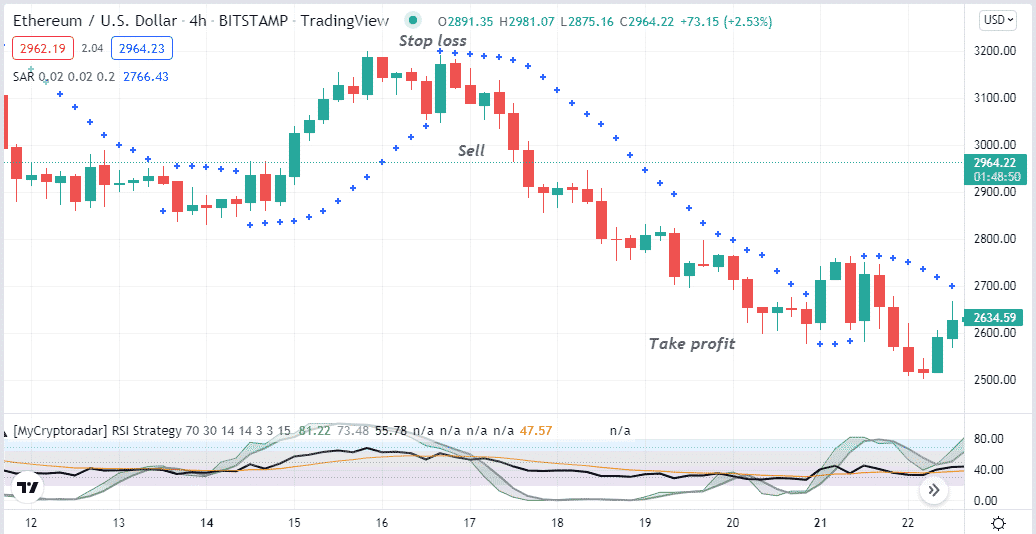
Bearish setup
Entry
These conditions above confirm the bearish momentum and suggest opening a sell position.
Stop loss
Set an initial stop loss above the current bearish momentum.
Take profit
Your sell position remains safe till the bearish momentum remains intact. Close the sell order by checking the conditions below:
- A bullish crossover occurs between the dynamic oscillator lines in the MYC indicator window near the lower (20) level.
- The dynamic black line starts sloping on the upside.
- Parabolic SAR dots switches on the downside of price candles.
Pros and cons
| 👍 Pros | 👎 Cons |
|
|
|
|
|
|
Final thought
Finally, this article introduces you to one of the best technical trading indicators that enables participation in enormous profitable trades. It only requires some practice to master these strategies alongside following some specific set of trade and money management rules to obtain the best results.


Comments