
Crypto squeeze strategy is one of the reliable trading methods that professional traders rely on. Expert crypto traders with millions of dollars capital always follow particular methods to execute constantly profitable trades. The need for crypto trading strategies came from the massive surge in blockchain technologies.
However, it is not wise to start trading with any method without a clear concept. The following section will reveal the crypto squeeze concept and sustainable trading methods with chart attachments that will help you determine the most potential entry/exit positions.
What is the crypto squeeze strategy?
The financial market involves many trading assets, including cryptocurrencies. These digital assets are volatile, so price change often occurs rapidly when the demand increases. It is common among financial assets that the volume drops before any rapid movement or breakouts. That low volatile phase represents the confusions or indecisions of traders or a consolidation phase on the asset price. It is an essential factor to understand current market phases.
For example, a crypto trader may place a sell order during a declining market condition, which will lead him to lose capital. The crypto squeeze strategy refers to determining low volatile phases to increase profitability.
How to trade using the crypto squeeze strategy?
There are many momentum indicators to determine market conditions. Expert crypto traders often use those indicators when seeking entry/exit points through these technical indicators. Many technical indicators can deliver that crypto squeeze trading positions, including Bollinger Bands (BB), Keltner channels indicator, RSI indicator, etc. You can use these indicators to obtain market context and place trades according to indicator readings as it becomes easier to predict future movements.
Short-term trading strategy
We use BB and Keltner channels indicators in this trading method. Both are popular indicators with three bands and use different calculations to obtain the market context. We change the color of the Keltner channels indicator to green so that it becomes easier to differentiate all bands.
- When the Keltner channel lower band crosses the BB lower band on the upside, the price enters a bullish trend.
- On the other hand, when the price declines, the Keltner channel’s upper band drops below the BB indicator’s upper band.
When the bands of the BB indicator come closer, it declares the volatility drops, and there might be a big move ahead. The wider these bands get, the more significant breakout occurs. Once the bands of the Keltner Channel cross the BB’s bands, it may be an initiation of a new trend. This trading method suits many crypto assets on different time frame charts. We recommend using this method on an hourly or 15min chart when seeking short-term entry/exit positions through this crypto squeeze method.
Bullish trade scenario
Apply both indicators at your target asset chart and observe when:
- The bottom band of the Keltner channel reaches above the bottom band of the BB indicator.
- The price comes near the middle bands of both indicators.
- The middle band of the Keltner channel indicator goes above the middle band of the BB indicator.
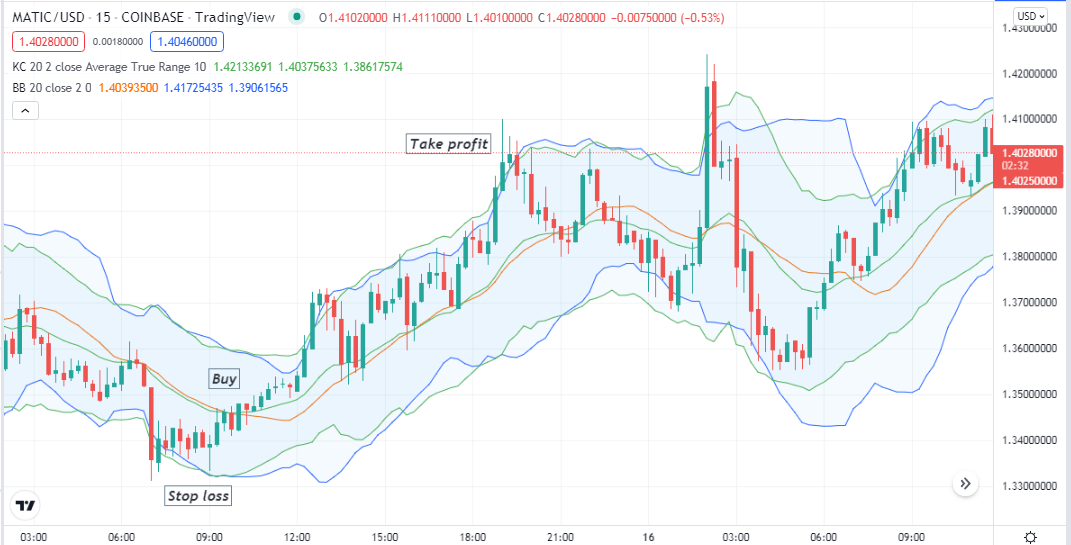
Bullish setup
Entry
When these conditions above match your target asset chart, the price already enters at a bullish trend with sufficient buy pressure. Enter a buy trade.
Stop loss
The initial stop loss will be below the recent swing low that occurs below the crossover of the lower bands.
Take profit
When the price reaches the upper bands of both indicators, the bullish pressure might decrease. Close the buy position when the upper band of the Keltner channel declines below the upper band of the BB indicator.
Bearish trade scenario
Apply both indicators at your target asset chart and observe when:
- The upper band of the Keltner channel reaches below the upper band of the BB indicator.
- The price comes near the middle bands of both indicators.
- The middle band of the Keltner channel indicator goes below the middle band of the BB indicator.
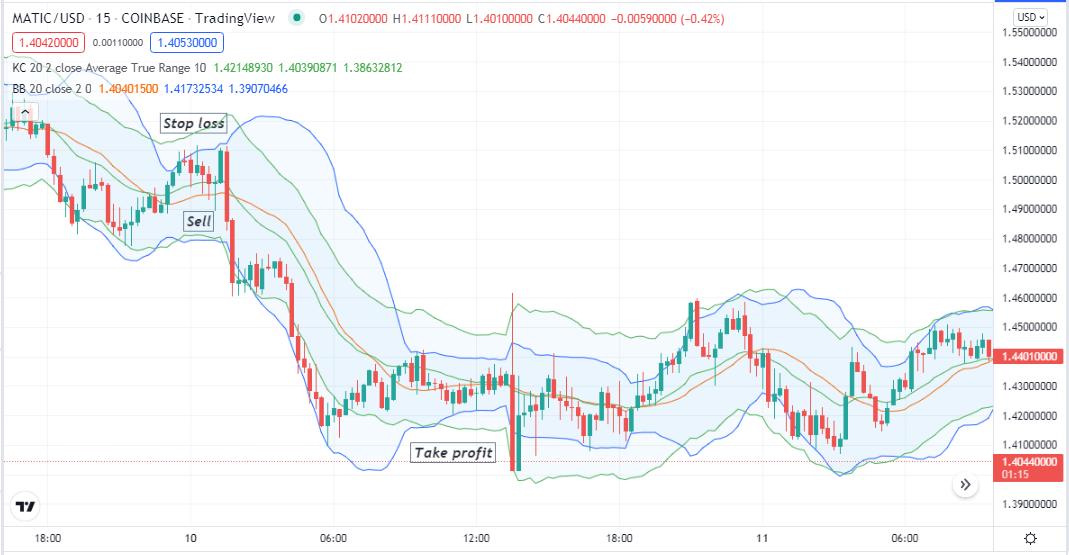
Bearish setup
Entry
When these conditions above match your target asset chart, the price already enters at a bearish trend with sufficient sell pressure. Enter a sell trade.
Stop loss
The initial stop loss will be above the recent swing high that occurs above the crossover of the upper bands.
Take profit
When the price reaches the lower bands of both indicators, the bearish pressure might decrease. Close the sell position when the lower band of the Keltner Channel declines below the lower band of the BB indicator.
A long-term trading strategy
We use the squeeze momentum indicator in this trading method and combine it with the BB indicator. The squeeze momentum indicator shows readings in an independent window that contains a central line and histogram bars on each side of that line. Increasing green histogram bars above the central line indicates bullish momentum on the asset price.
On the other hand, red histogram bars appear below the central line declaring bearish momentum. This trading method suits many time frame charts, but the D1 or H4 charts are the preferable charts to generate long-term trading positions.
Bullish trade scenario
When the bands of the BB indicator gets closer, observe the squeeze momentum indicator:
- The price crosses above the middle band of the BB indicator, and the bands start to get wider.
- Green histogram bars take place above the central line of the squeeze momentum indicator.
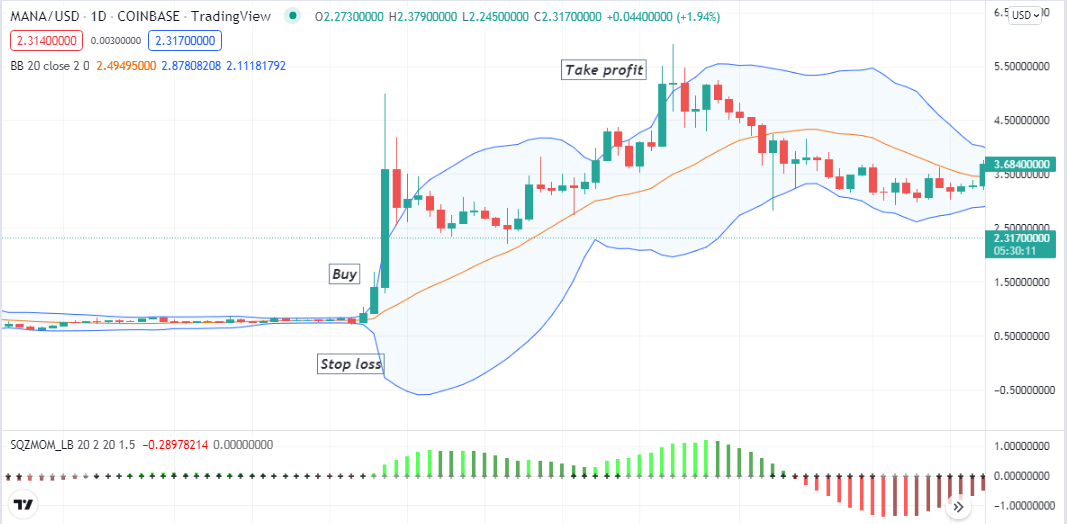
Bullish setup
Entry
These conditions above match your target asset chart, indicating a possible breakout on the upside. Place buy order.
Stop loss
The initial stop loss will be below the current bullish momentum.
Take profit
Close the buy order when:
- The price starts declining toward the middle band of the BB indicator from the upper band.
- Red histogram bars take place below the central line of the squeeze momentum indicator.
Bearish trade scenario
When the bands of the BB indicator gets closer, observe the squeeze momentum indicator:
- The price crosses below the middle band of the BB indicator, and the bands start to get wider.
- Red histogram bars take place below the central line of the squeeze momentum indicator.
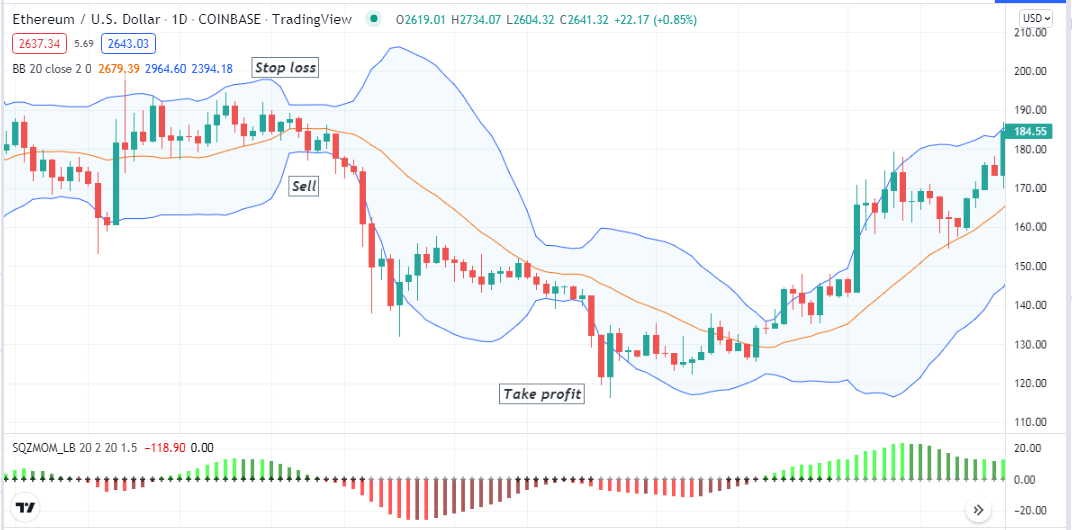
Bearish setup
Entry
These conditions above match your target asset chart, indicating a possible breakout on the downside. Place sell order.
Stop loss
The initial stop loss will be above the current bearish momentum.
Take profit
Close the sell order when:
- The price starts rising toward the middle band of the BB indicator from the lower band.
- Green histogram bars take place above the central line of the squeeze momentum indicator.
Pros and cons
| 👍 Pros | 👎 Cons |
|
|
|
|
|
|
Final thought
Crypto investors seek many sustainable trading methods to deal with the volatile marketplace, and the crypto squeeze strategy is at the top of the list. We suggest practicing and mastering before applying these methods on the live crypto charts.


Comments