
Slippage is a common term in the financial market, especially in crypto. So any investor who conducts their trades should be aware of this term as this issue has become remarkable in the crypto market. There are several ways and trading methods to avoid slippage in the crypto market.
However, when anyone wants to avoid slippage and execute successful trades in any crypto asset, it requires learning about slippage, avoiding procedures, and following well-defined trading methods. This article will highlight slippage and trading strategies to avoid this issue.
What is slippage in crypto?
The price difference between the expected price when anyone orders and the price when the order executes. For instance, imagine going to a shop and seeing mangos on sale for $2. You go to the counter, and they ask $3 for mango. It may be unusual in grocery stores but a common scenario in the cryptocurrency market.
There are positive slippage and negative slippage. Positive slippage means may you want to expect to buy an asset at a certain price and order executes lower than that price. Meanwhile, you may need to pay more for an asset than you expect with negative slippage.
Why does slippage occur, and how to calculate it?
Slippage usually occurs for two factors: liquidity and volatility.
-
Liquidity
Some crypto assets investors don’t trade so often due to newness in the marketplace or lack of popularity. These reasons make that asset with less liquidity and spread between ask and bid price wider. So dramatic price change occurs when executing any trade.
-
Volatility
Slippage occurs due to wild price swings, and some crypto assets are so volatile that price changes dramatically within a short time.
Meanwhile, calculating slippage, investors use the formula:
$ of slippage / (LP – EP) x 100 = % slippage
where,
EP = expected price
LP = limit price/ worst expected price
How to avoid slippage?
Investors use several ways to deal with slippage. You can avoid it by:
- Executing trades on layer two solutions.
- Using more gas fees.
- Using ”limit order” features.
- Adjusting slippage tolerance levels.
- Using an over-the-counter (OTC) desk.
When the price breaks out above or below any key level, possible slippage can occur. So try to trade in a trendy market environment as available buyers and sellers are on the marketplace.
A short-term trading strategy
In this trading method, we use MACD alongside the ADX indicator to generate short-term trade ideas avoiding slippage. MACD indicates the trend-changing environments and continuations with two dynamic signal lines and histogram bars of both sides of a central line in an independent window.
Meanwhile, the ADX indicator shows the current trend’s strength on an independent window. When the reading increases above 20, it declares sufficient strength of the current trend to continue further. We recommend using a 15-min or Hourly chart to catch the most potent short-term trades through this method.
Bullish trade scenario
When seeking to open buy positions, observe:
- The dynamic blue line crosses the dynamic red line on the upside at the MACD window.
- Both lines are heading on the upside.
- MACD green histogram bars take place above the central line.
- ADX value increases above 20.
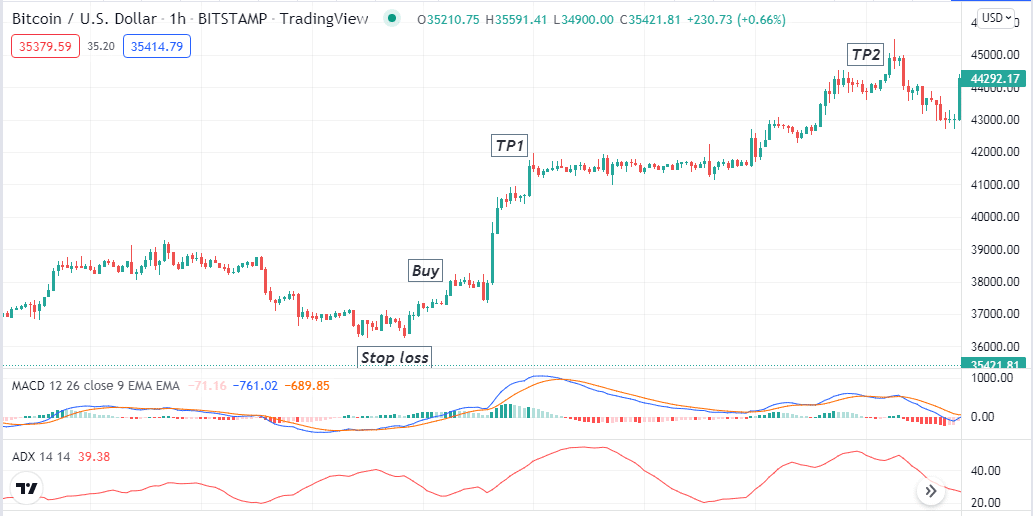
Bullish setup
Entry
Match these conditions above and place a buy order.
Stop loss
Place an initial stop loss below the current swing low with a buffer of 5-10pips.
Take profit
Close the buy order when:
- The dynamic blue line crosses the dynamic red line on the downside at the MACD window.
- MACD red histogram bars take place below the central line.
- ADX value drops below 20.
Bearish trade scenario
When seeking to open sell positions, observe:
- The dynamic blue line crosses the dynamic red line on the downside at the MACD window.
- Both lines are heading on the downside.
- MACD red histogram bars take place below the central line.
- ADX value increases above 20.
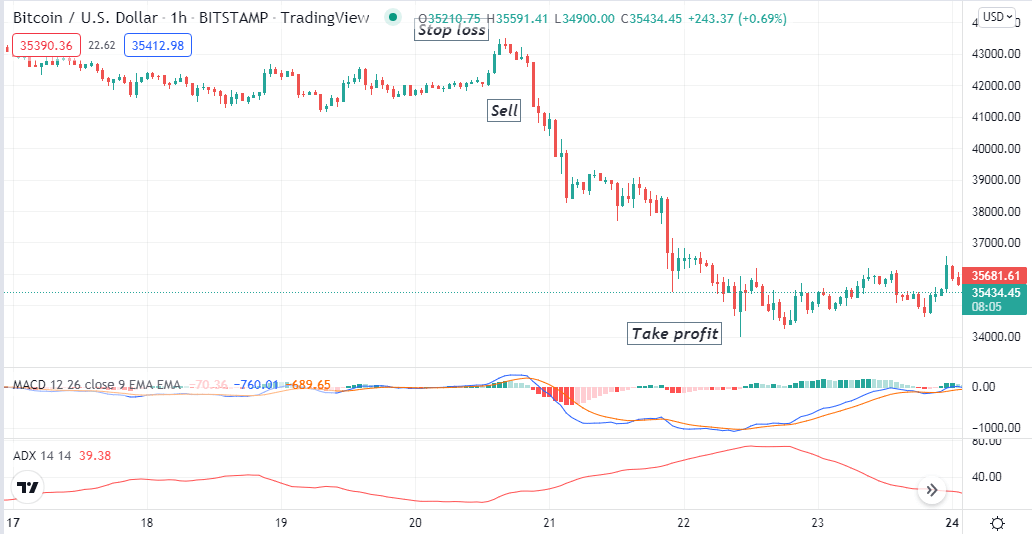
Bearish setup
Entry
Match these conditions above and place a sell order.
Stop loss
Place an initial stop loss above the current swing high with a buffer of 5-10pips.
Take profit
Close the sell order when:
- The dynamic blue line crosses the dynamic red line on the upside at the MACD window.
- MACD green histogram bars take place above the central line.
- ADX value drops below 20.
A long-term trading strategy
This trading m method involves using the RSI and the volume indicator to determine the market context and avoid slippage. The RSI indicator is so popular among financial investors as it shows historical and current strength-weakness depending on the closing price of candles of a specific period. Meanwhile, the volume indicator shows the buying or selling pressure on any asset price during any specific period. We suggest applying this strategy on an H4 or daily chart to catch the most potent long-term trades.
Bullish trade scenario
When you seek to open buy positions through this method, check:
- The RSI dynamic line is above or near the central (0.0) line and tends to go more upside.
- The volume indicator declares increasing buying pressure on the asset price.
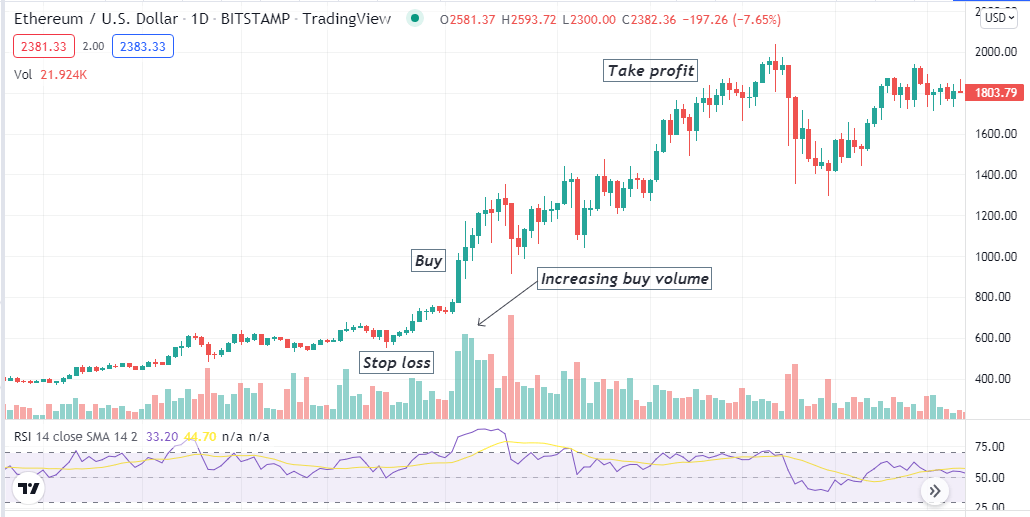
Bullish setup
Entry
When these conditions above match your target asset chart, it declares sufficient bullish momentum to open a buy position.
Stop loss
Place an initial stop loss below the current bullish momentum.
Take profit
Close the buy order when:
- The RSI dynamic line reaches the upper (70) line or starts to decline toward the central (0.0) line after reaching that level.
- The volume indicator declares increasing selling pressure.
Bearish trade scenario
When you seek to open sell positions through this method, check:
- The RSI dynamic line is below or near the central (0.0) line and tends to go more downside.
- The volume indicator declares increasing selling pressure on the asset price.
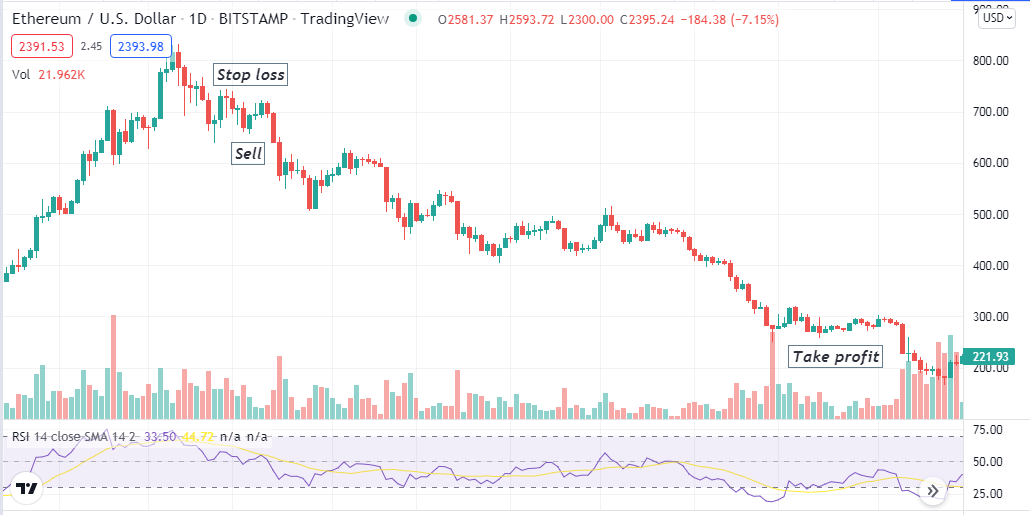
Bearish setup
Entry
When these conditions above match your target asset chart, it declares sufficient bearish momentum to open a sell position.
Stop loss
Place an initial stop loss above the current bearish momentum.
Take profit
Close the sell order when:
- The RSI dynamic line reaches the lower (30) line or starts to rise toward the central (0.0) line after reaching that level.
- The volume indicator declares increasing buying pressure.
Pros and cons
| 👍 Pros | 👎 Cons |
|
|
|
|
|
|
Final thought
Slippage is a common fact in crypto assets. When you can avoid slippage, it will save you from spending more money to purchase an asset. Expert crypto traders frequently use these tools to place frequent trades.


Comments