
Investing in cryptocurrencies needs close attention to understanding the factors that cause the price move. The basic idea of crypto trading is to anticipate the future price movement based on previously set metrics. The stock-to-flow ratio is one of the metrics that help traders make structured decisions.
As the stock to flow has historically correlated with Bitcoin, it is easy to forecast the future BTC price using this metric. Moreover, Bitcoin is the first crypto ever with a limited supply of safe haven assets. Therefore, finding the bitcoin price direction would help traders understand the broader cryptocurrency market.
The following section will closely monitor how the stock-to-flow metric works and how to make buying and selling decisions using this tool.
What is stock-to-flow (S2F) crypto trading strategy?
The stock-to-flow model is a process to anticipate the future price direction of a trading asset by finding its scarcity. In general, this method applies to traditional precious metals like gold and silver, but the recent emergence of cryptocurrencies allows it to apply to crypto tokens like Bitcoin or Ethereum.
Bitcoin is the first cryptocurrency with a limited supply of 21 million coins. Therefore, when the whole coin is mined, no coin will be left, which is the primary sign affecting the token’s supply-demand. When the supply is limited, the instrument will be scarce, leading to a massive price surge following the stock-to-flow concept.
How to trade using stock-to-flow in trading strategy?
In the stock to flow method, the stock is the number of reserves, while the flow represents the yearly production rate. Investors can quickly identify the Bitcoin S2F by grabbing the existing Bitcoin and dividing it with the flow.
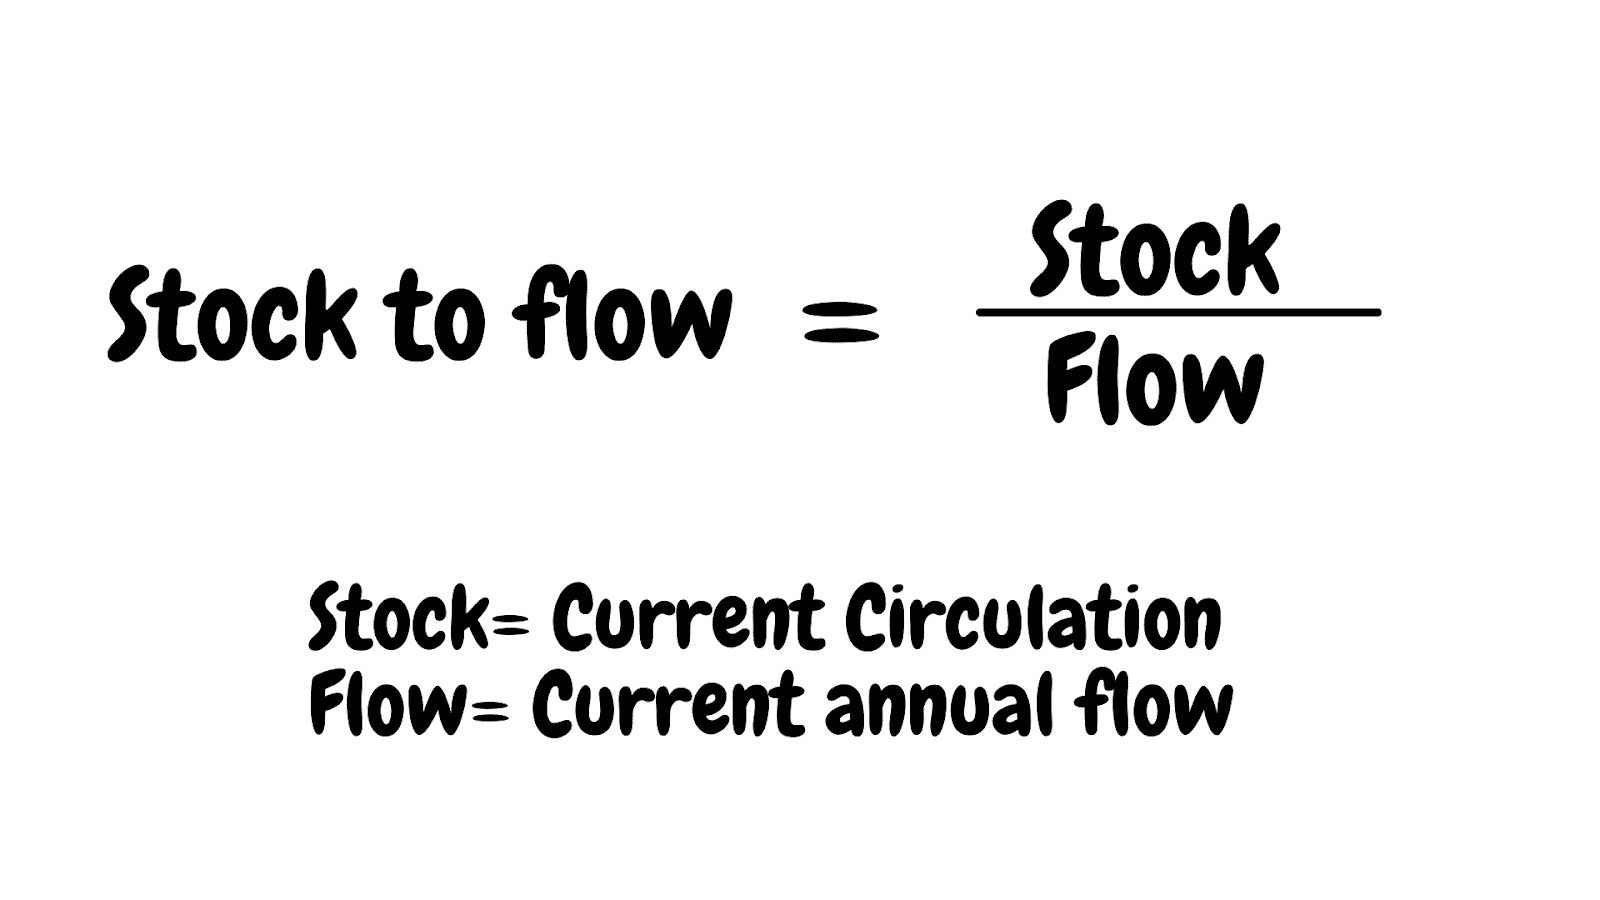
Stock to flow formula
Currently, almost 19M BTC are in circulation, roughly 90% of the overall supply of 21M. On the other hand, the current annual flow of BTC is 328,500, based on its current block reward size. Now apply the formula to find the S2F for Bitcoin.
S2F = 19M/328,500 or 57.84
On the other hand, the S2F of Gold is 62. The value of Gold’s S2F changes from increased or decreased production in gold mining fields. On the other hand, Bitcoin has a systematic schedule known as halves. After each halving, the S2F ratio changes.
A short-term trading strategy
The cryptocurrency stock-to-flow model indicates the coin’s scarcity. Therefore, the basic trading idea is to find the stock-to-flow higher to consider a higher demand and lower supply.
Bullish trade scenario
We will use the S2F to find the overall market context and make trading decisions using other indicators.
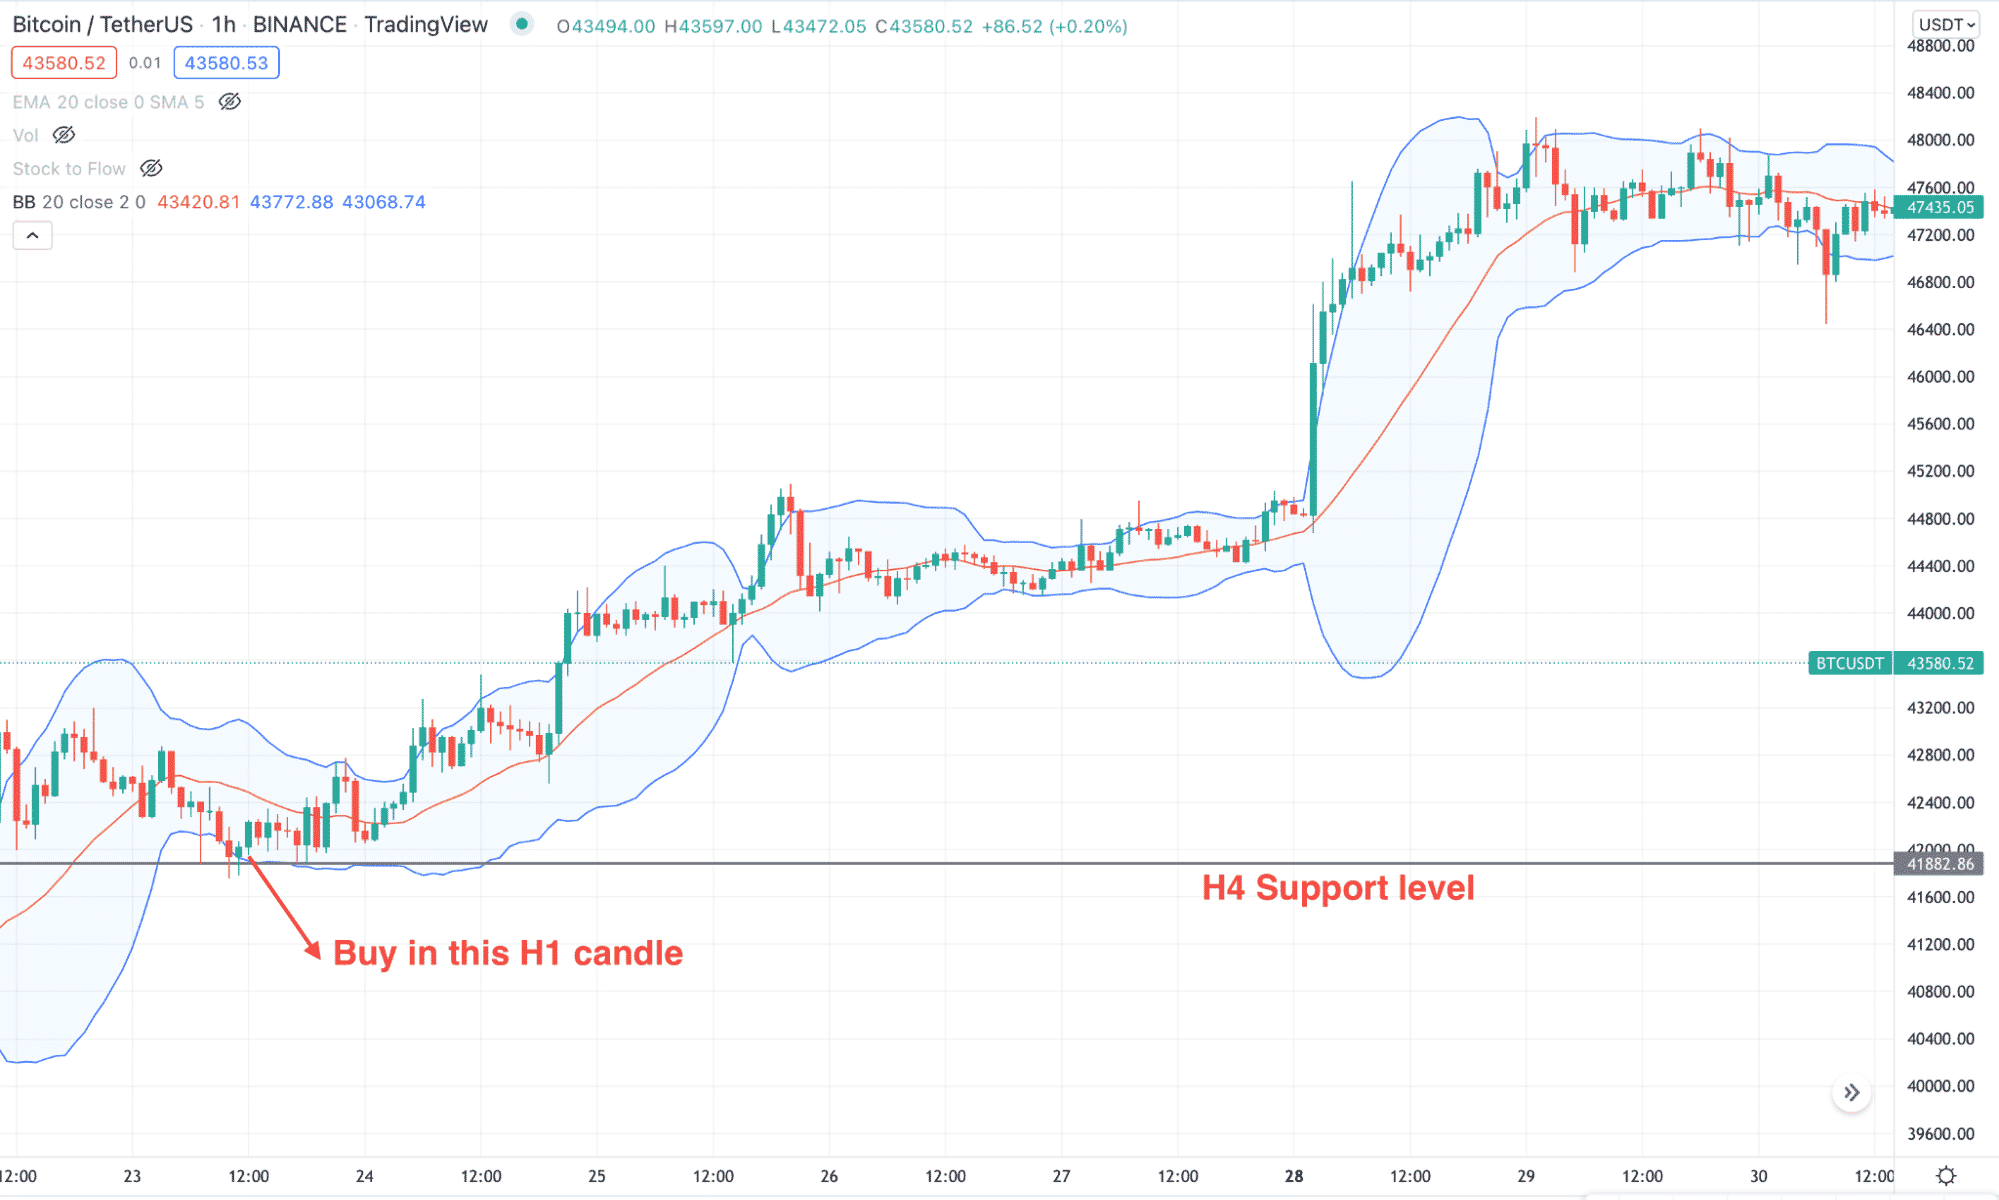
Bitcoin stock to flow
Entry
Before buying an instrument, make sure to find these conditions on the chart:
- In the daily time frame, the price remains closer to the lower band of stock to flow.
- In the H4 chart, the price is trading above any important support level.
- Now move to the H1 chart, and find the price to show a bullish rejection from the lower Bollinger Bands.
Stop-loss
As the trade is taken on the H1 chart, the stop loss is below the near-term swing level with some buffer.
Take profit
You can close profit once the price provides a 1:2 risk vs. reward ratio and use the same strategy as long as the stock-to-flow is supportive.
Bullish trade example
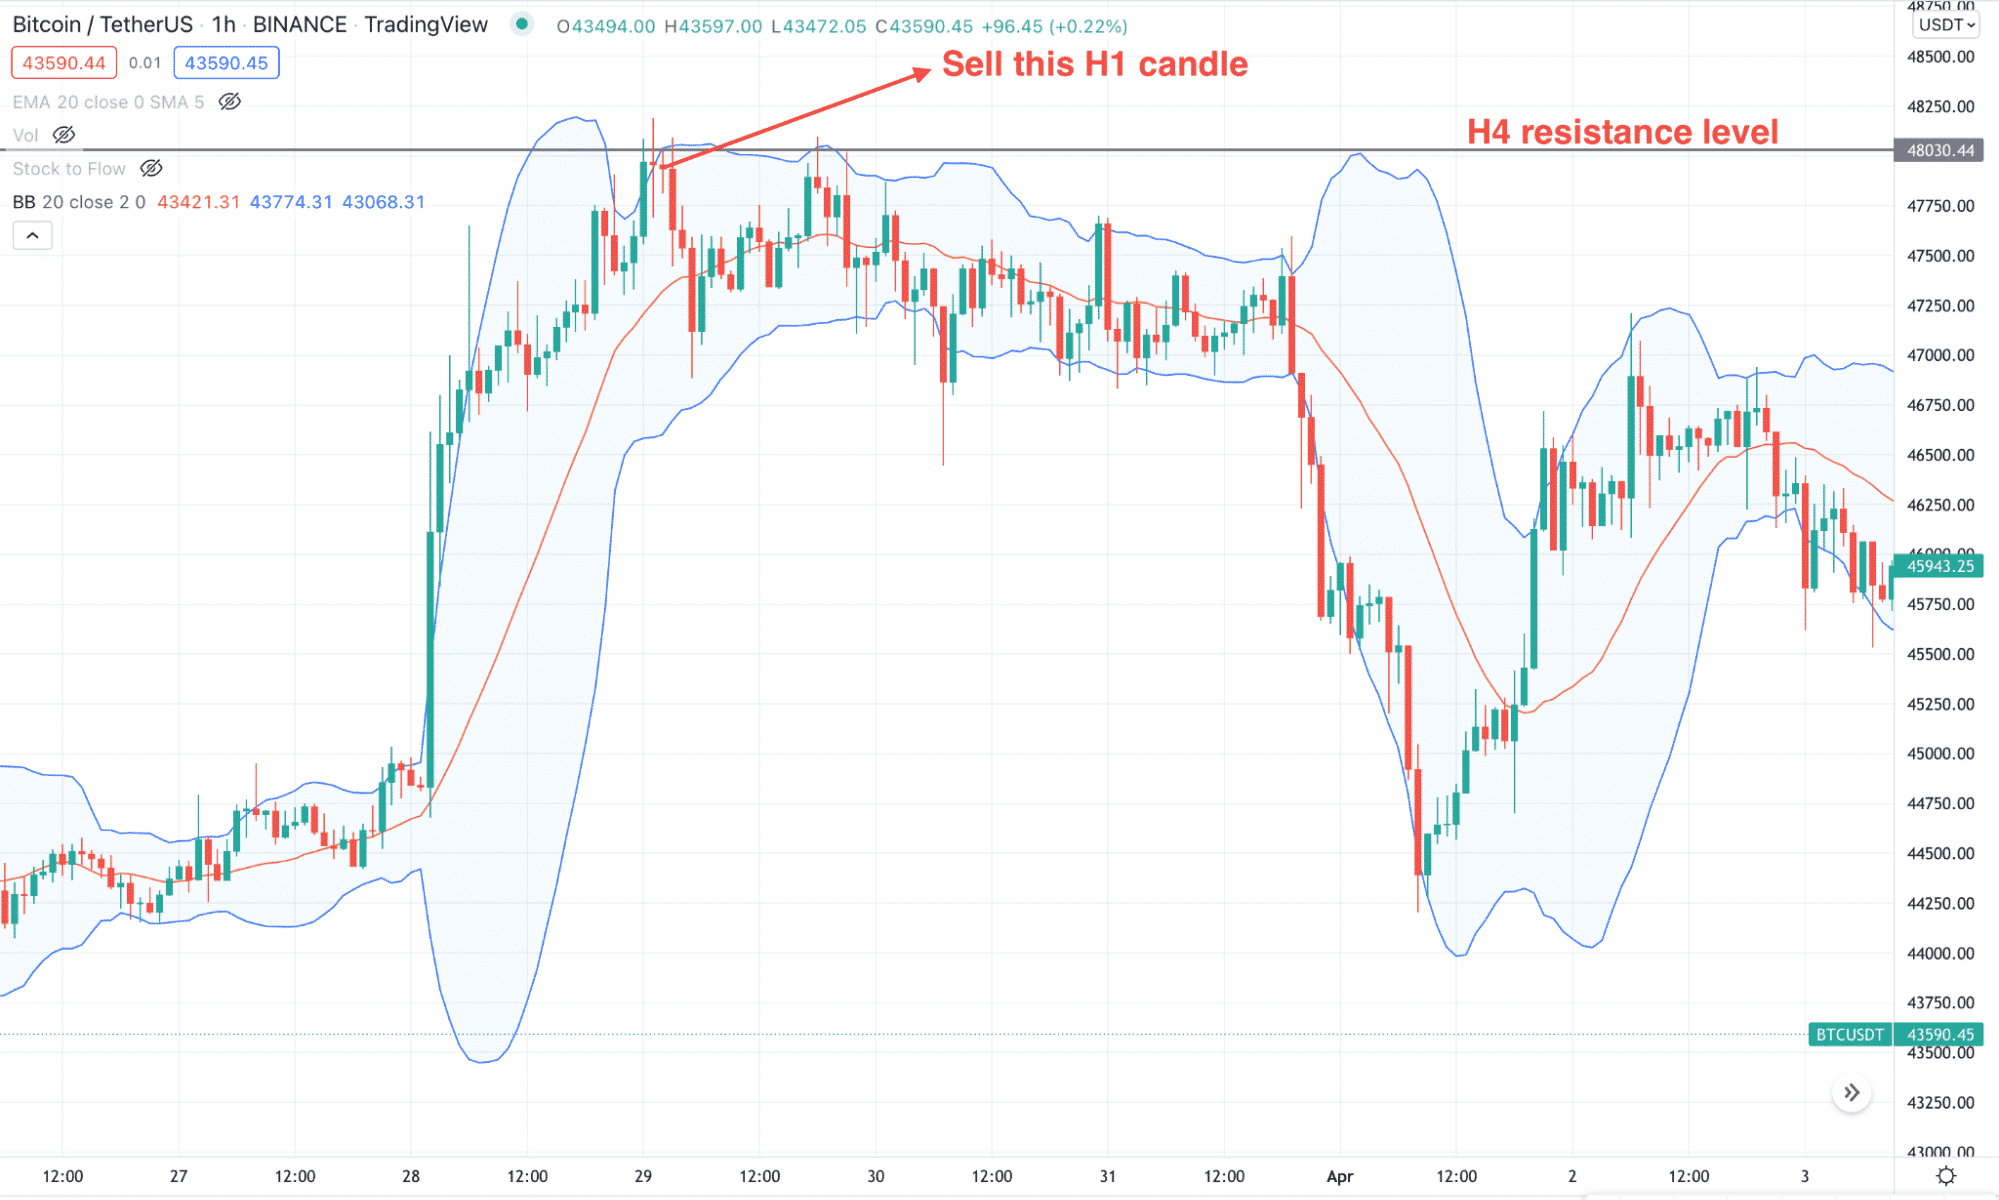
Bearish trade scenario
In the sell trade, the price should be above the 50% level of the stock-to-flow lines.
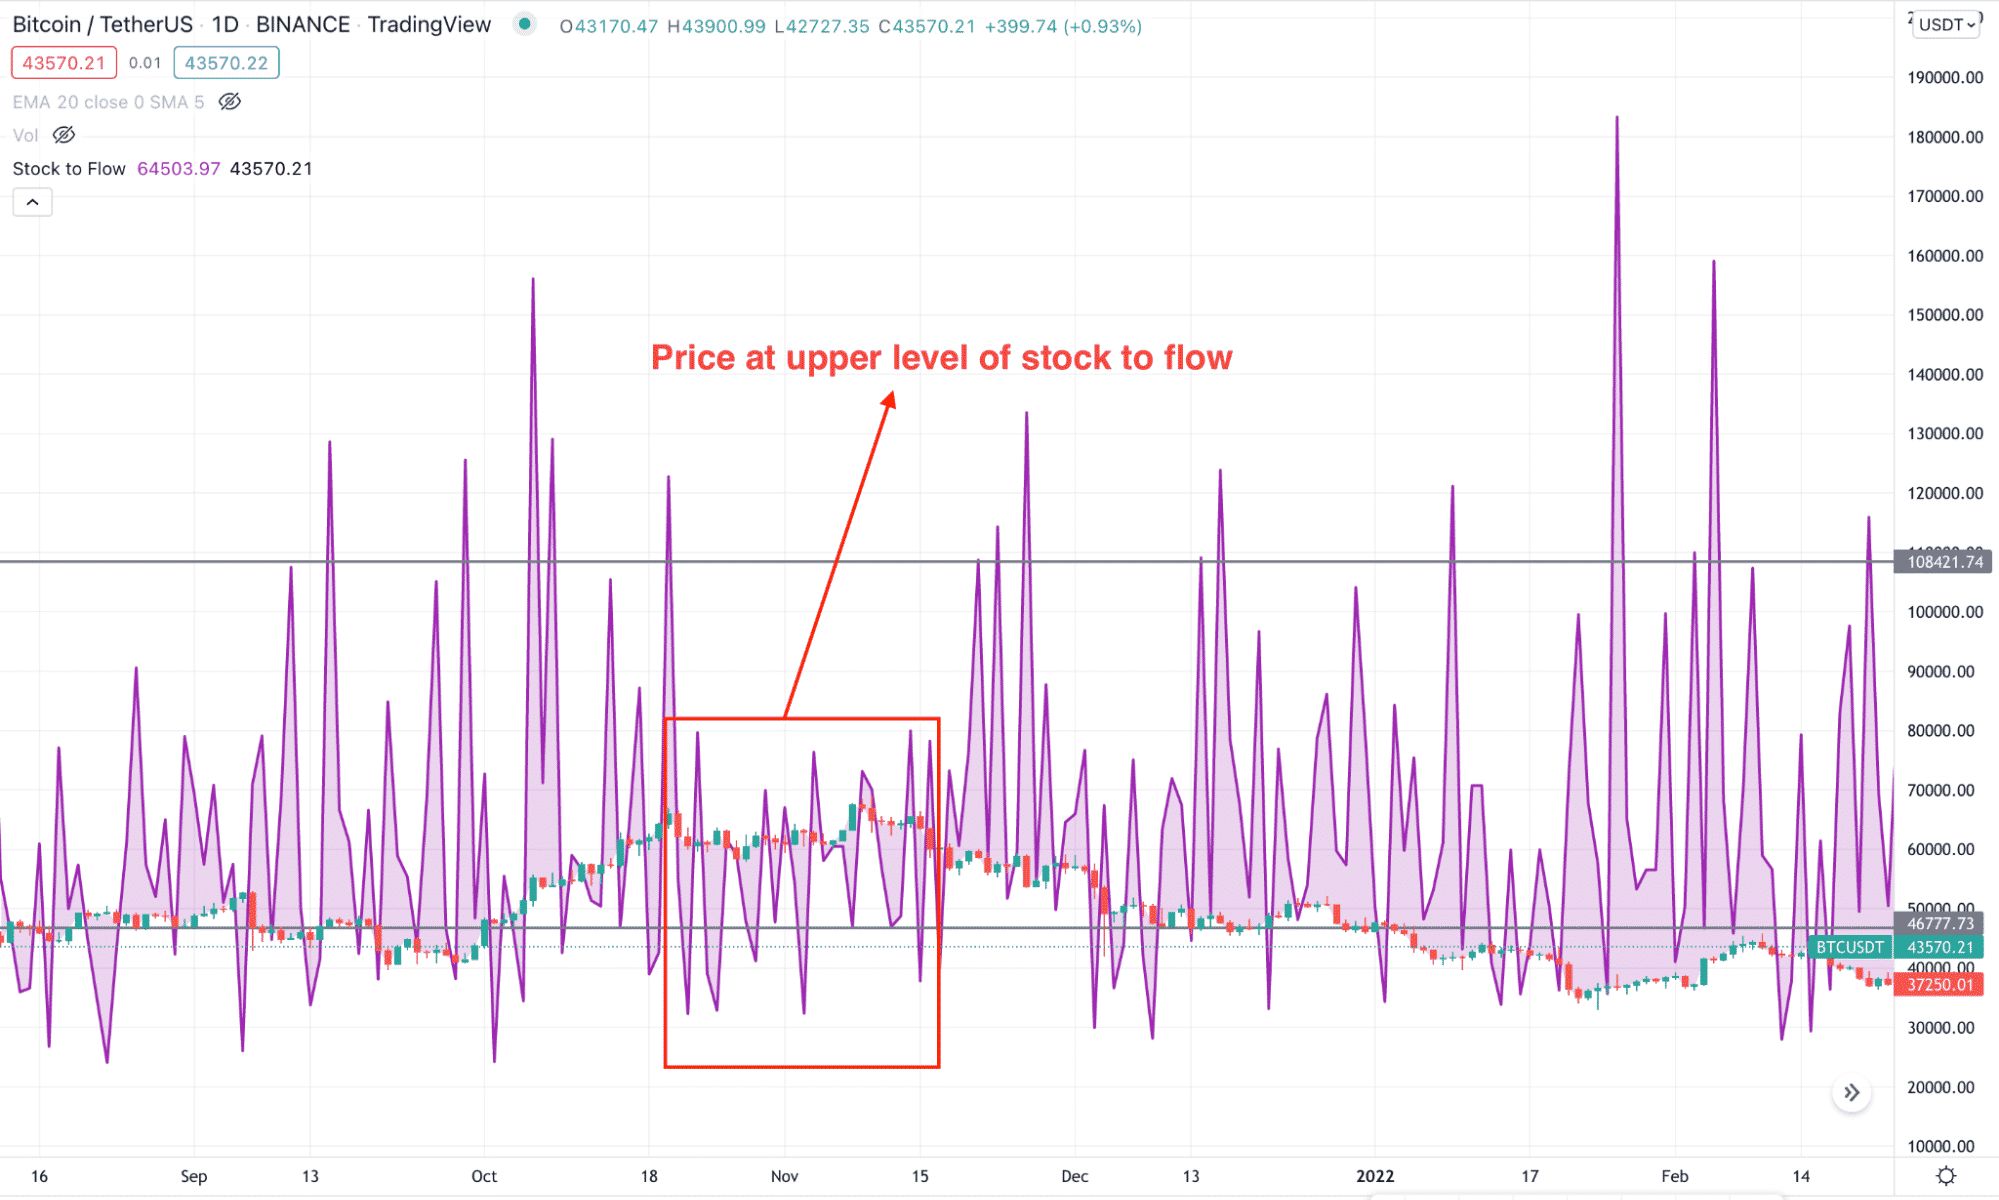
Bitcoin stock to flow
Entry
Before selling an instrument make sure to find these conditions on the chart:
- In the daily time frame, the price remains closer to the upper band of stock to flow.
- In the H4 chart, the price is trading below any important resistance level.
- Now move to the H1 chart, and find the price to show a bearish rejection from the upper BB.
Stop loss
As the trade is taken on the H1 chart, the stop loss is above the near-term swing level with some buffer.
Take profit
You can close profit once the price provides a 1:2 risk vs. reward ratio and use the same strategy as long as the stock-to-flow is supportive.
Bearish trade example
A long-term trading strategy
The long-term method is to find the HODLIng level from which investors can find the opportunity of grabbing the long-term benefit from the crypto investment.
Bullish trade scenario
In the buy trade, the price should be close to the lower bands of stock to flow indicator. Later on, move to the daily chart and identify the golden cross for buy and the death cross for sell.
Entry
The buy trade is valid once these conditions are present in the price:
- The stock to flow shows a buy signal.
- The price formed a golden cross between 50 EMA and 200 SMA.
- The price corrected lower and formed a bullish rejection candlestick from the 50 EMA.
Stop loss
You can hold the trade until it moves below the near-term swing low, below the dynamic 50 EMA.
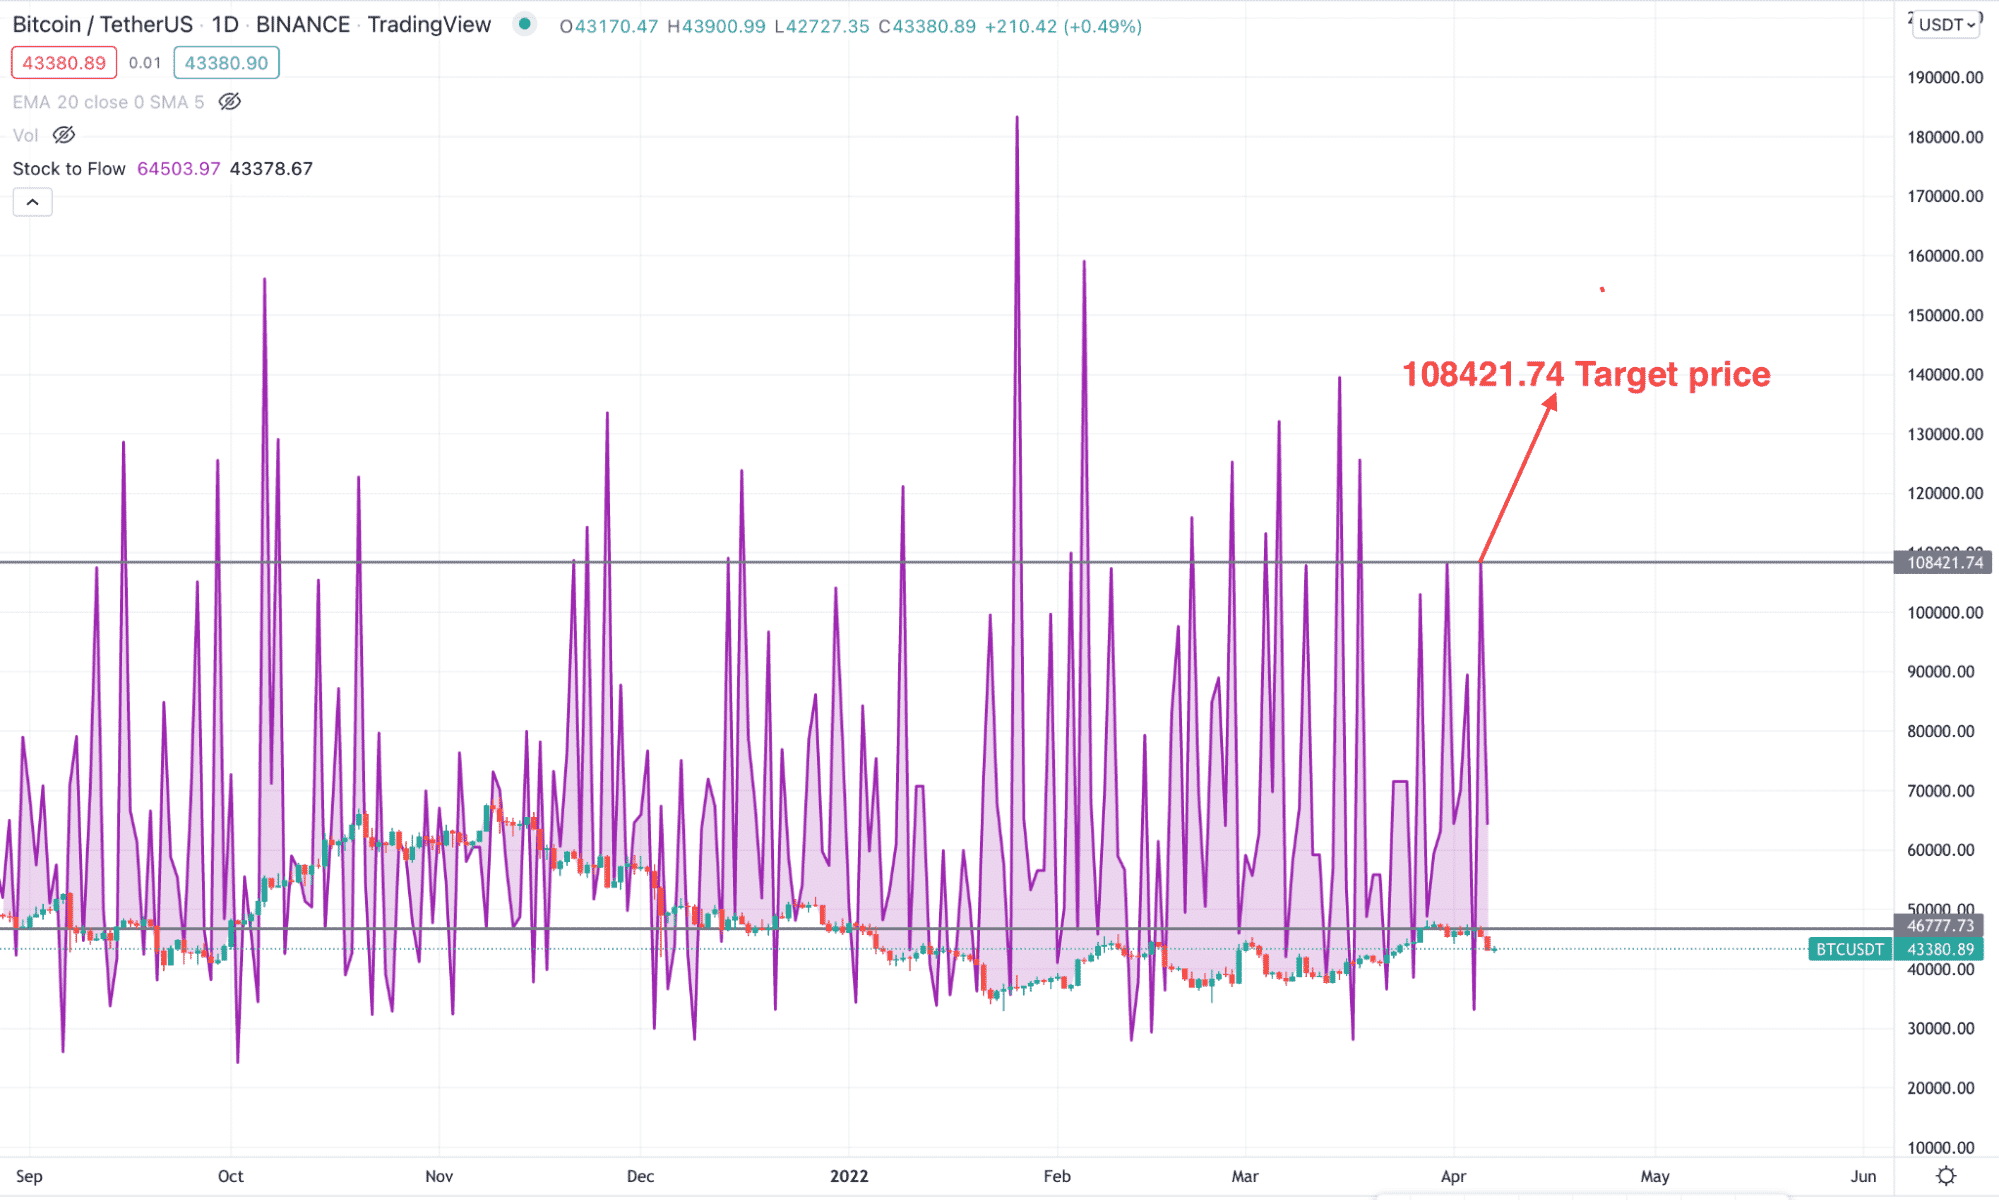
Take profit
The ultimate profit target of the instrument is the current stock to flow level. In 2022, the current Bitcoin target level is 108421.74 US dollars.
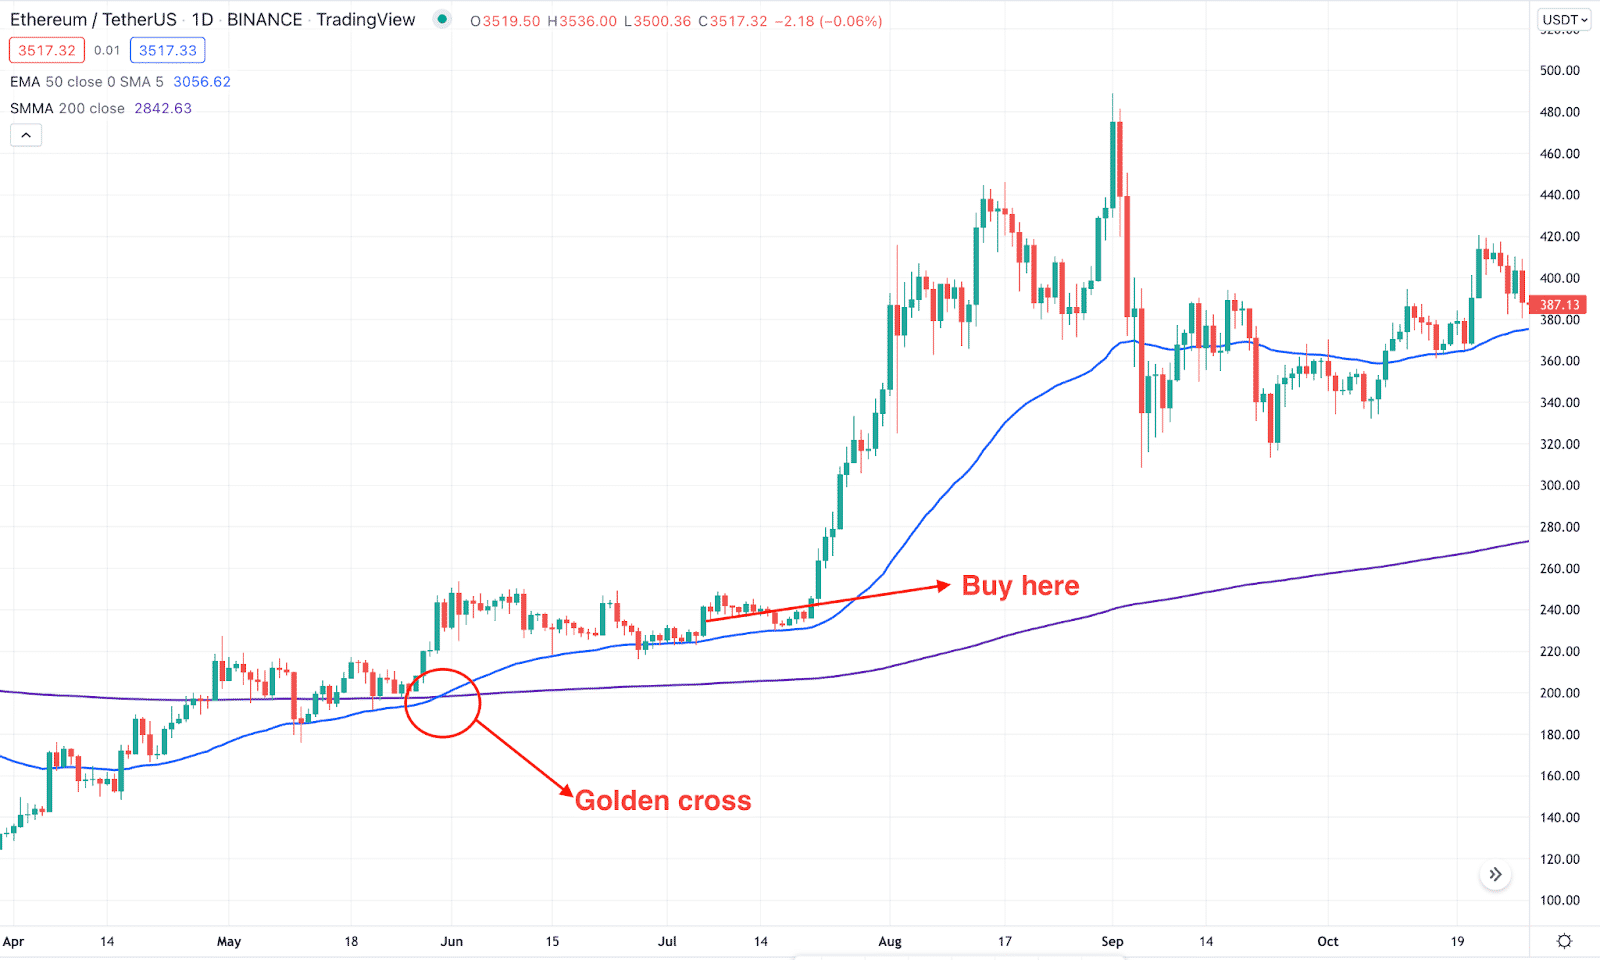
Long-term buy trade
Bearish trade scenario
The bearish scenario will be valid if the price reaches the 2022 Bitcoin target level by making a close gap between the price and stock to flow upper line.
Entry
The sell trade is valid once these conditions are present in the price:
- The stock to flow shows a sell signal.
- The price formed a death cross between 50 EMA and 200 SMA.
- The price corrected higher and formed a bearish rejection candlestick from the 50 EMA.
Stop loss
You can hold the trade until it moves below the near-term swing high, above the dynamic 50 EMA.
Take profit
The selling pressure from the stock to flow indicator is tricky as it only shows a possible corrective momentum of the price. In that case, you should manage the trade using a risk management system.
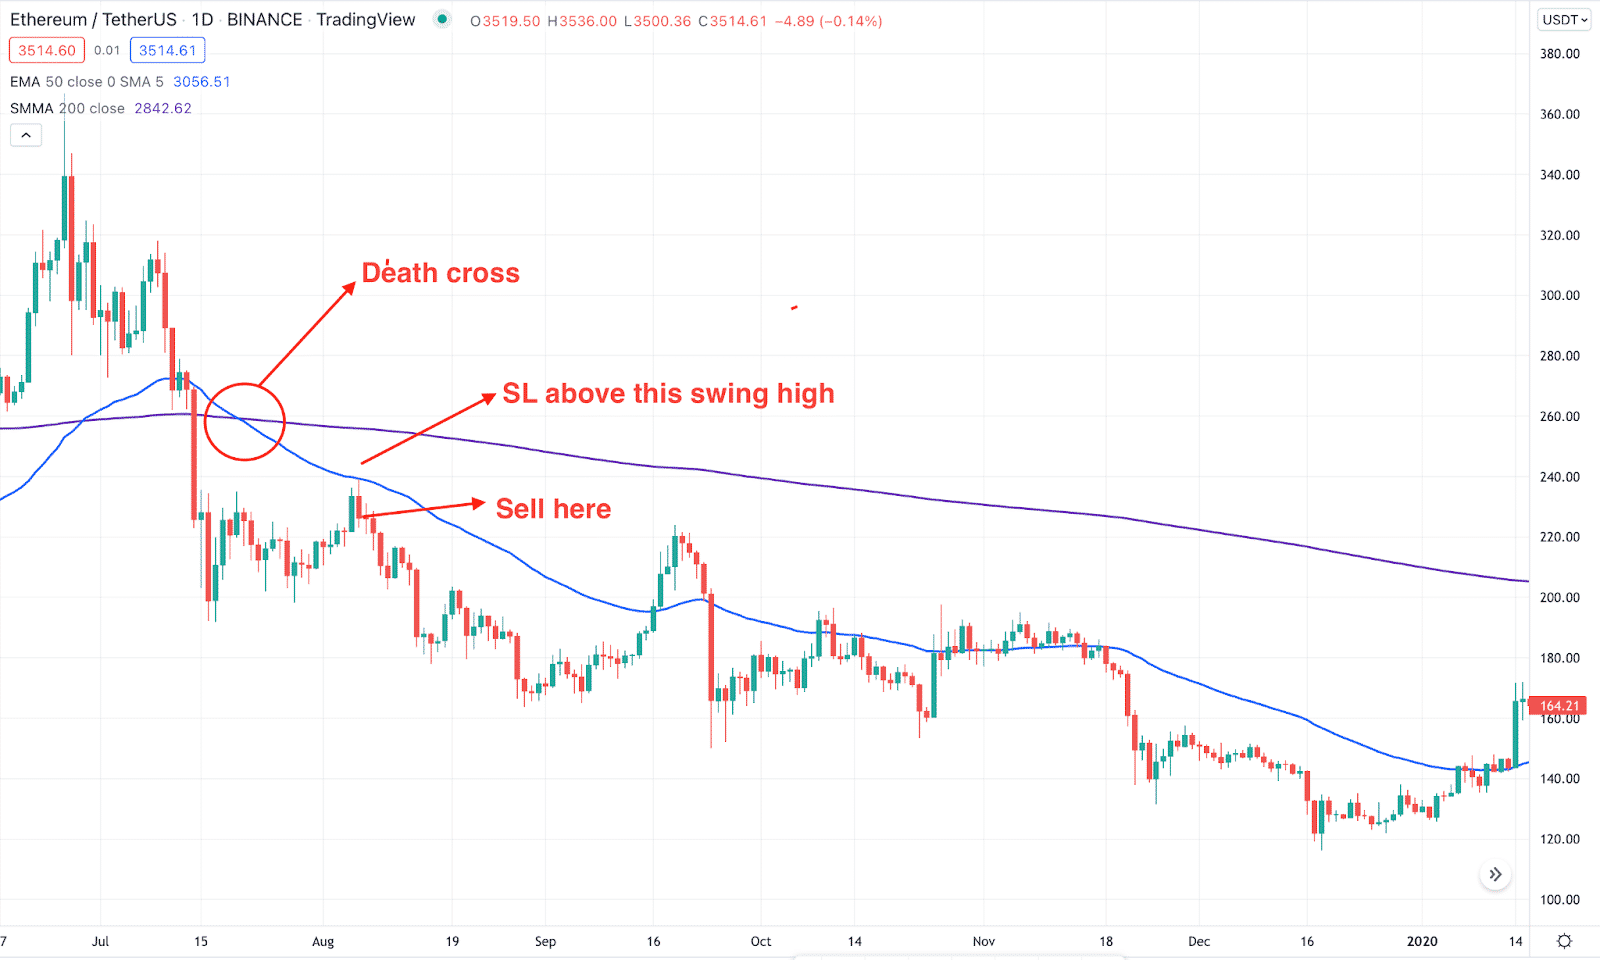
Long-term sell trade
Pros and cons
| 👍 Pros | 👎 Cons |
| Stock to flow is an important metric to identify the current scarcity of a crypto asset compared to supply. | Although the stock flows through essential indicators, it is only profitable in higher time frames. |
| It helps traders to identify the market direction before attempting to buy or sell the instrument. | The crypto is very volatile and the stock to flow does not show any opportunity of making profits from the short-term price fluctuation. |
| Technical analysts easily combine this metric with other indicators while making trading decisions. | Stock to flow does not work for cryptos that have an unlimited supply, like Dogecoin. |
Final thoughts
Stock to flow is an essential metric that a trader can use while making trading decisions in any time frame. However, investors have a closer attention to the risk management of every trade as the crypto market is volatile where an alacritous rise and fall is widespread.


Comments