The Morning star is a graphic pattern consisting of three candlesticks to provide an idea about buying an instrument. It shapes after a downward trend depicting the beginning of an upward trend. This trading tool might increase your success rate in the crypto context.
Usually, traders pay attention to the structure of a Morning star, and afterward, search validation for a reversal is undoubtedly taking place utilizing supplementary indicators. The following section will see this pattern crypto trading guide comprising exact trading systems for buying and selling.
What is the Morning star pattern?
It is a core tool for investors who seeks the best price to buy a cryptocurrency from the bottom. It defines when the selling pressure of a crypto asset is over, and investors are likely to buy it. The cryptocurrency market is very volatile, where buying a token from a random price might incur an immediate loss. Finding the actual bottom and opening the position after the Morning star pattern would be a good solution.
It combines multiple candles, where the first candle comes with a strong selling momentum. Later on, the second candlestick is the star with a real short body. The real short body is split up from the first candlestick’s real body. And the differences in the real bodies of the two candlesticks determine a star shape, a spinning top, or Doji. The star doesn’t need to shape under the first candlestick’s low and may subsist inside its lower shadow.
However, the star is the first manifestation of lackings since it shows the incapability of sellers for driving the price close considerably lower than the past period close. This lacking is validated by the third candlestick that must be light-colored and close well within the first candlestick’s body.
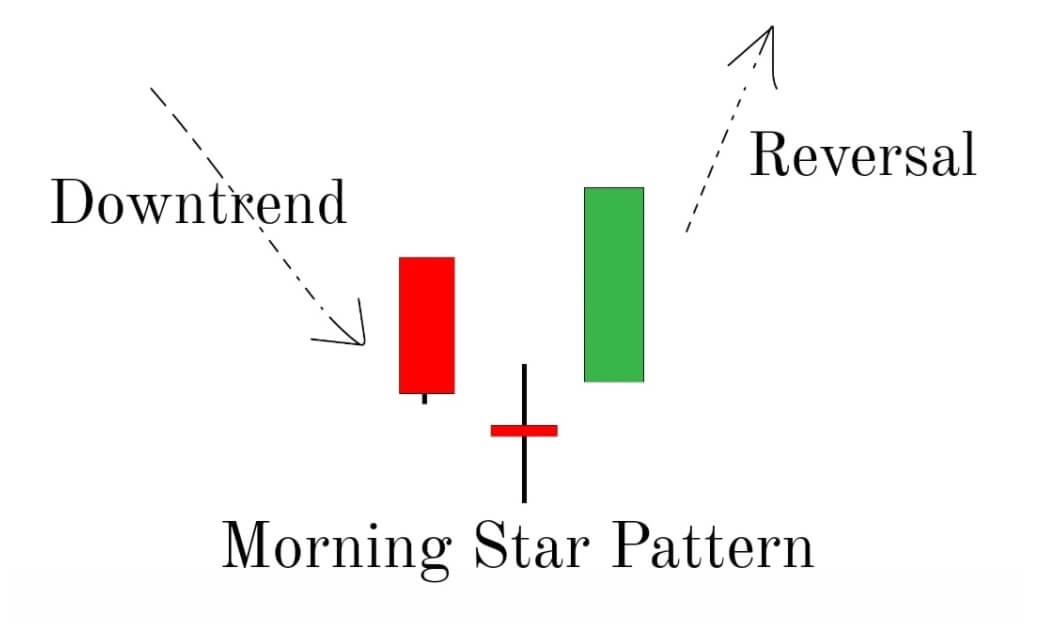
Morning star pattern
How to trade using the pattern?
The basic idea of using this pattern is to find a price where the crypto token has a higher success rate on trend reversal. If you are interested in buying a crypto asset you don’t like the price to move further down from your purchase price, do you?
Normally, a trader is willing to identify the escalating volume across the three sessions forming up the pattern, with the third day noticing the majority of the volume. Often, on the third day, the high volume is deemed as the pattern’s validation along with the following uptrend, regardless of different indicators. However, along with the Morning star pattern in the third session riding the uptrend till another hint of reversal, the trader may go for a bullish position in the cryptocurrency. In that case, the Morning star would be a solution as it provides a higher possibility of changing the trend after forming it at the bottom.
A short-term trading strategy
The short-term approach is to find a location from where buying a crypto token is wise despite the broader market outlook. The recent surge in CFDs trading in cryptocurrency made it tradable in brokers where investors can take both buy and sells at a time.
In this short-term method, we will use Bollinger Bands (BB) besides the pattern to define the exact price direction reliably. This method applies to any time frame, but sticking to 5 minutes or 15 minutes charts would be best.
Bullish trade scenario
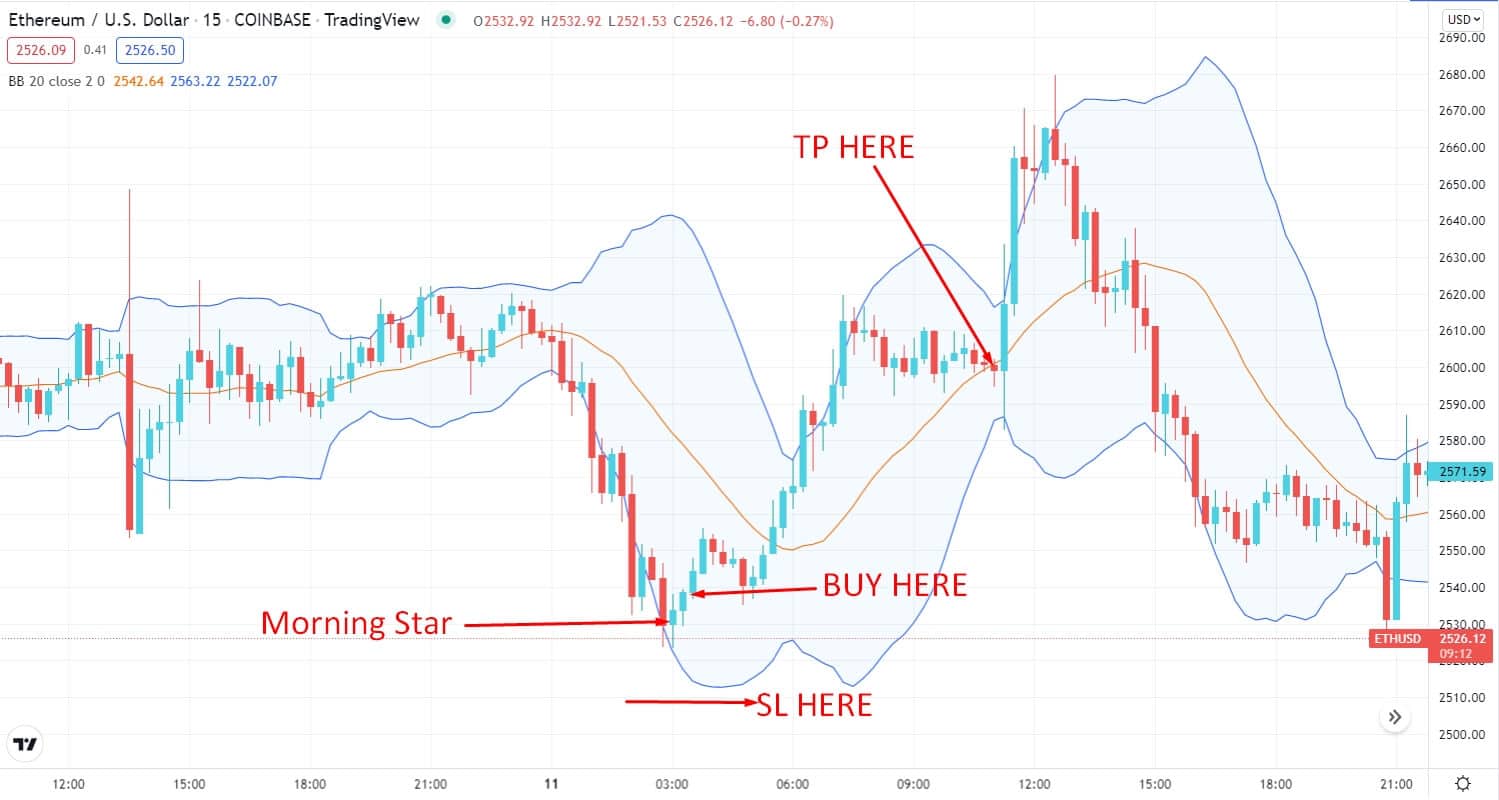
First, you must add the BB indicator to the chart before finding the Morning star pattern. Both BB and the Morning star pattern should show a buy signal to validate the bullish entry.
Short-term bullish trade scenario
Entry
Open a buy trade when the Morning star pattern appears and forms a candle close from the BB lower bands.
Stop-loss
Set the stop loss order below the BB low with at least a 5-10 pips buffer.
Take profit
Take the profit, when the price had a bearish close below the Bands middle line after hitting the BB upper band.
Bearish trade scenario
Add BB in the price chart and find the following conditions:
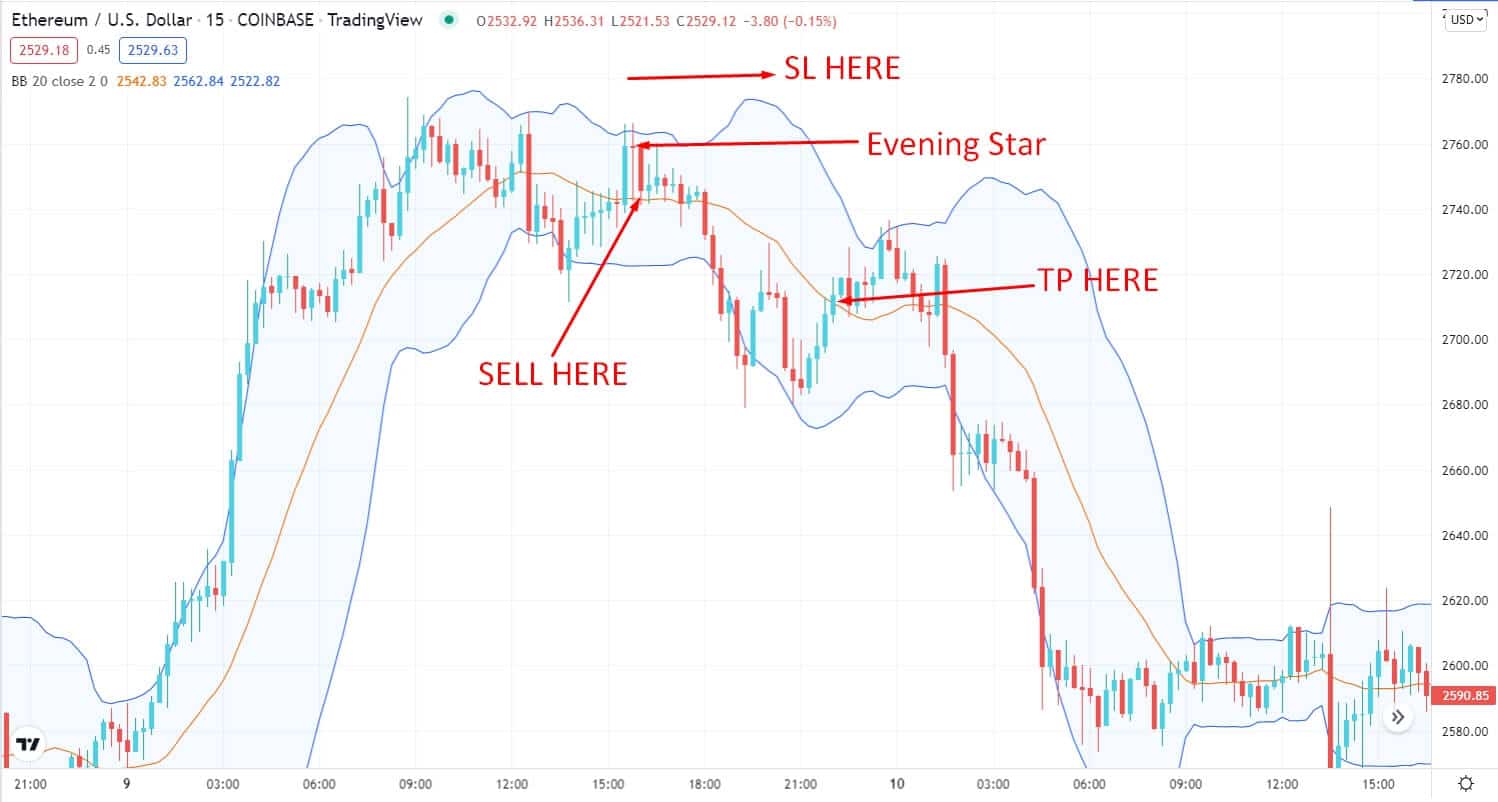
- The Morning star pattern is familiar as the Evening star pattern in the bearish trade scenario as it comes after a bullish trend.
Short-term bearish trade scenario
Entry
Open a sell trade after forming the Evening star pattern with a bearish close below the upper BB.
Stop-loss
Set the stop-loss order higher to the BB upper bands with at least a 5-10 pips buffer.
Take profit
Take the profit, when the price had a bullish close above the Bollinger Bands middle band after hitting the Bollinger Bands lower band.
A long-term trading strategy
The long-term Morning star strategy is based on psychological S/R levels in the daily chart. This method will use the Stochastic oscillator indicator to increase our trade accuracy. Moreover, this strategy we will apply to the D1 time frame.
Bullish trade scenario
First, you have to add the Stochastic oscillator indicator to the chart. Then look for the price to create a morning star pattern on the support level:
- The Stochastic indicator adds more confluence by creating a bullish crossover.
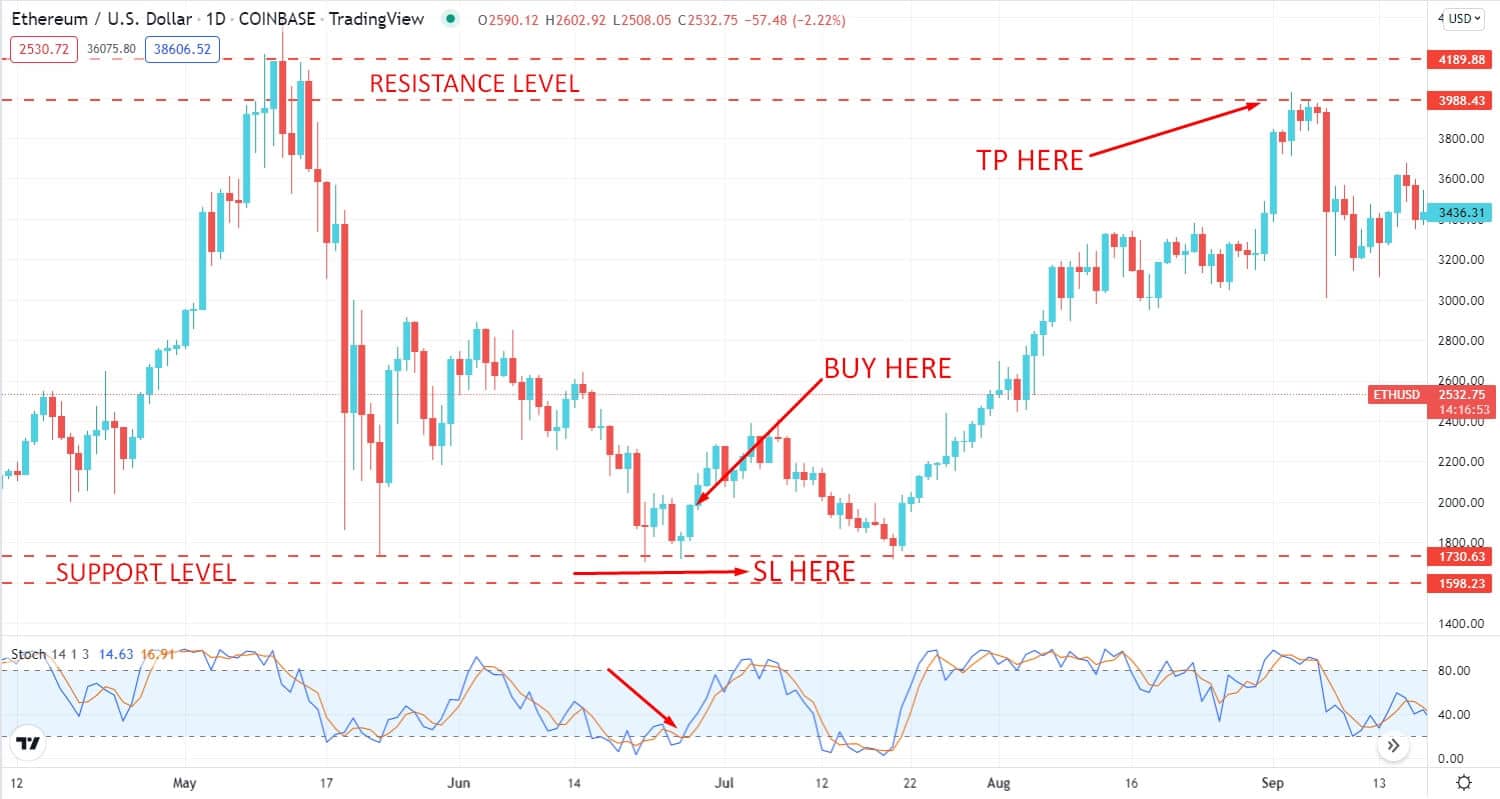
Long-term bullish trade scenario
Entry
Enter a buy trade when the price has a bullish candle close after creating a Morning star pattern on the support level.
Stop-loss
Place the stop loss order below the morning star pattern with at least a 10-15 pips buffer.
Take profit
Set the take-profit order by targeting the next resistance level. Otherwise, you can take the profit by calculating at least a 1:3 risk/reward ratio.
Bearish trade scenario
First, you have to add the Stochastic oscillator indicator to the chart. Then look for the price to create an evening star pattern on the support level.
- The Stochastic indicator adds more confluence by creating a bearish crossover.
- The Morning star pattern is familiar as the Evening star pattern in the bearish trade scenario as its forms at the end of the bullish trend.
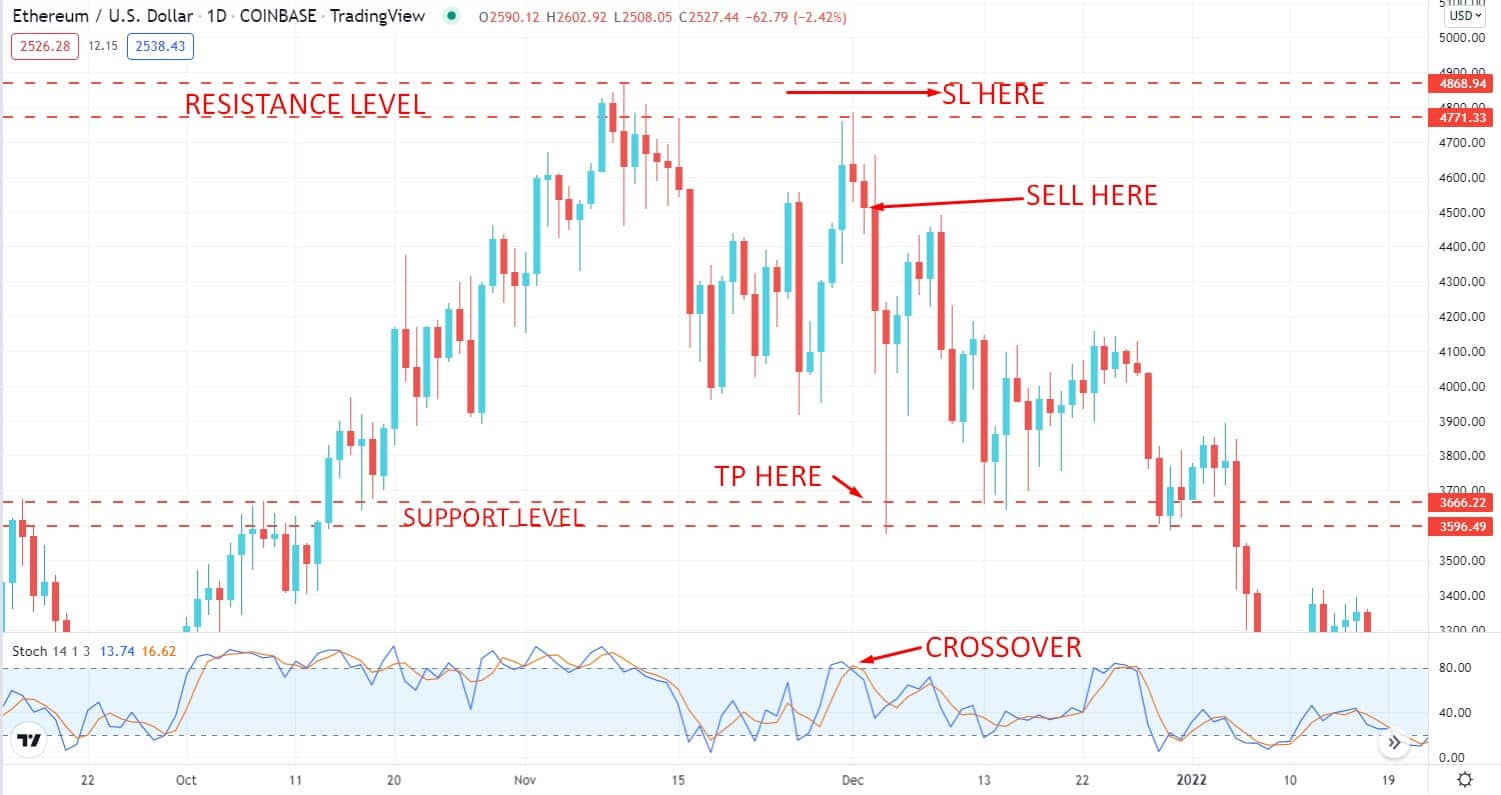
Long-term bearish trade scenario
Entry
Enter a sell trade when the price has a bearish candle close after creating an Evening star pattern on the resistance level.
Stop-loss
Place the stop loss order above the Evening star pattern with at least a 10-15 pips buffer.
Take profit
Set the take-profit order by targeting the next support level. Otherwise, you can take the profit by calculating at least a 1:3 risk/reward ratio.
Pros and cons
| 👍 Pros | 👎 Cons |
|
|
|
|
|
|
Final thoughts
To conclude, traders should use the morning star pattern as a combination of other technical indicators for the trend reversal’s validation. In long trades, the pattern gives the best output because the optimum level of accuracy comes to the pattern when it is at a robust support level. Moreover, It is also can be used for market scalping. Still, the Morning star must not be utilized standalone; instead, it should be combined with other technical analysis indicators.


Comments