
In 1994, Patric Mulloy developed the double exponential moving average, which appeared in an article in Stocks & Commodities magazine. In that article, Patric Mulloy recommended that the common moving averages (MA) were not as precise in giving trading signals.
He characterized it as the lag factor since the indicators use historical data. So, as the solution, he recommended utilizing mathematical calculations to eliminate the lag in the exponential moving averages (EMAs).
However, traders have depended on the MA to identify the entry points and profitable exits. Still, the severe existing lag is a common issue with various MAs. The double exponential moving average, also known as DEMA, offers a solution here by enumerating a quick averaging technique.
What is the double exponential moving average (DEMA)?
It is a technical indicator that can eliminate the lag in the outcome of a conventional MA. Traders use it to lessen the amount of noise that may manipulate the movements on a price chart.
Resembling various MAs, the tool is useful for defining the trend in the price of a certain asset. Also, the trader can identify an uptrend if the price goes over the.
On the other hand, it’s a downtrend when the price moves under its average. DEMA can generate a signal of a constant change in the trend while the price intersects the average. However, it uses two exponential averages for removing the chart’s lag as per its name upon the double exponential moving average.
DEMA on chart
How to trade using DEMA in trading strategy?
Trading with this indicator is very effortless. An uptrend is confirmed if the asset’s price is over the DEMA and the DEMA is increasing. On the contrary, if the price is under the tool along with the DEMA collapsing confirms a downtrend. As mentioned above, numerous traders portray two or more DEMAs with various retrospect over a single chart. Trading signals can be produced while these lines intersect.
A short-term trading strategy
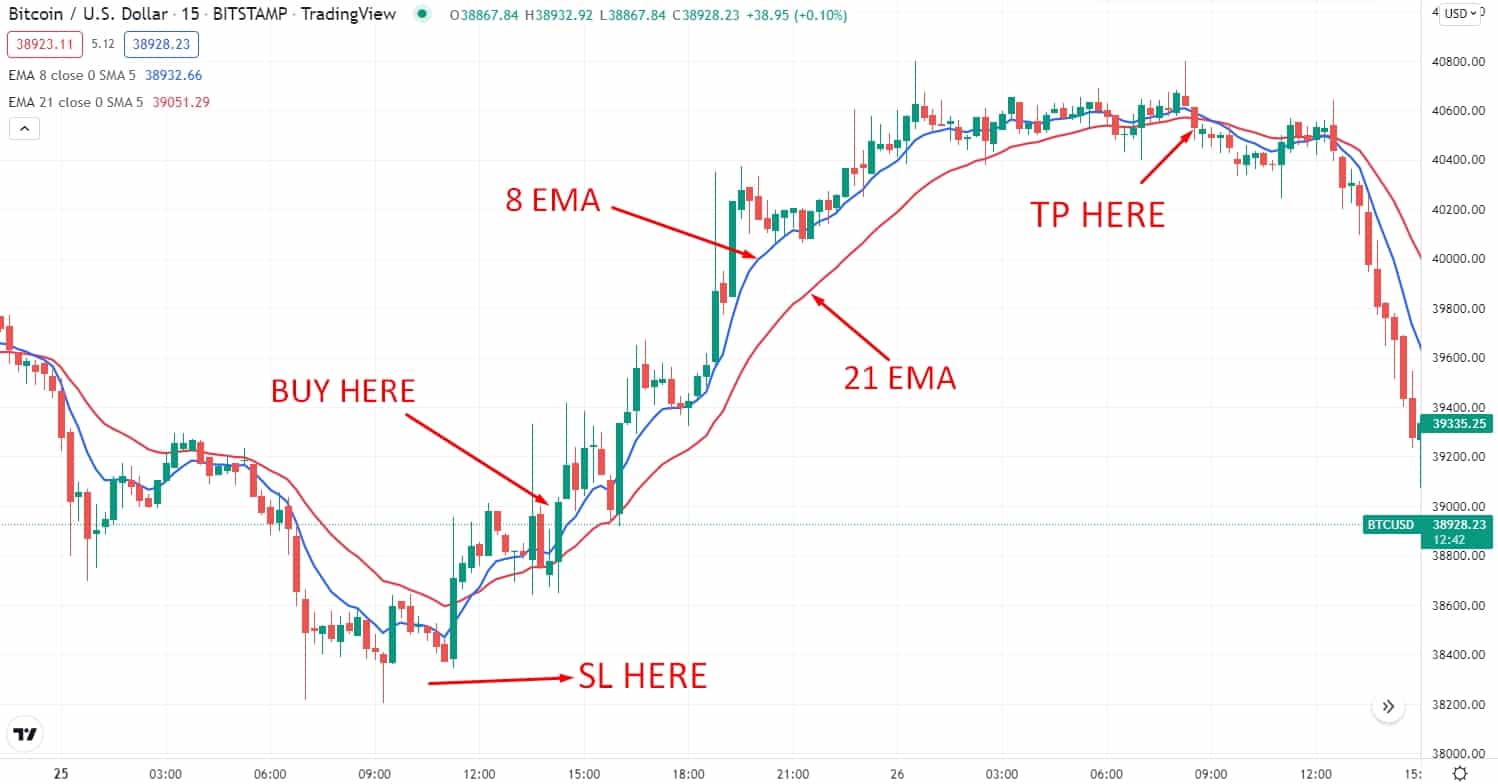
The strategy has developed based on the 2 EMA’s crossover. We will add the 8-period EMA and the 21-period MA in this method.
- When the 8-period EMA crosses above the 21-period EMA, it indicates a buy signal.
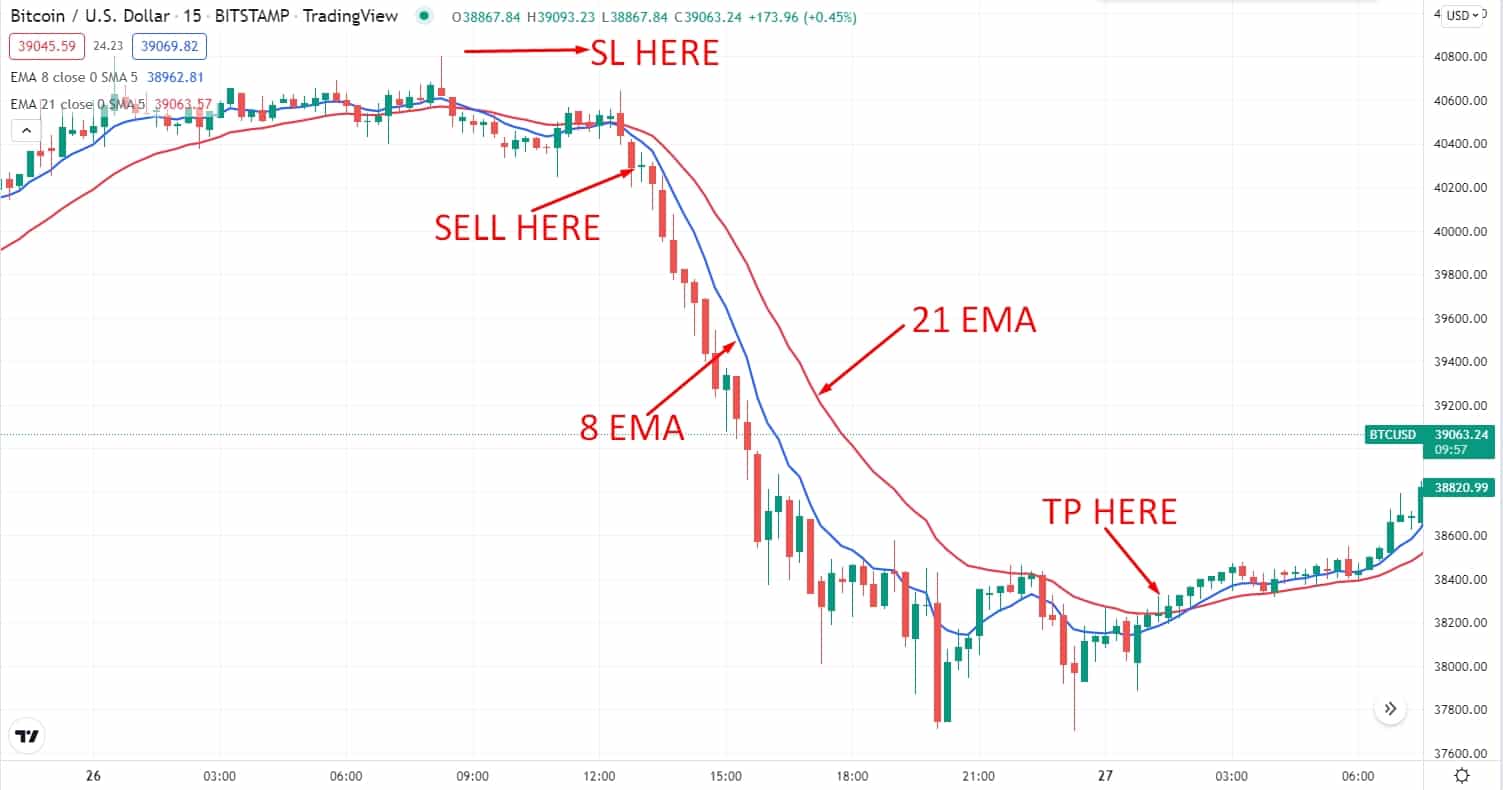
- When the 8-period EMA crosses below the 21-period EMA, it indicates a sell signal.
Moreover, this strategy will apply to the M5 and M15 time frames.
Bullish trade scenario
Short-term bullish trade scenario
Entry
Look for the price to break above the DEMA and retrace back to it. Enter a buy trade when the price has an impulsive bullish candle close after a downside retracement.
Stop-loss
Place the stop loss order below the last swing level with at least a 5-10 pips buffer.
Take profit
Take the profit when the price breaks below the DEMA with a bearish candle. Or else, you can target at least a 1:3 risk/reward ratio.
Bearish trade scenario
Short-term bearish trade scenario
Entry
Look for the price to break below the DEMA and retrace back to it. Enter a sell trade when the price has an impulsive bearish candle close after an upside retracement.
Stop-loss
Place the stop-loss order above the last swing level with at least a 5-10 pips buffer.
Take profit
Take the profit when the price breaks above the DEMA with a bullish candle. Or else, you can target at least a 1:3 risk/reward ratio.
A long-term trading strategy
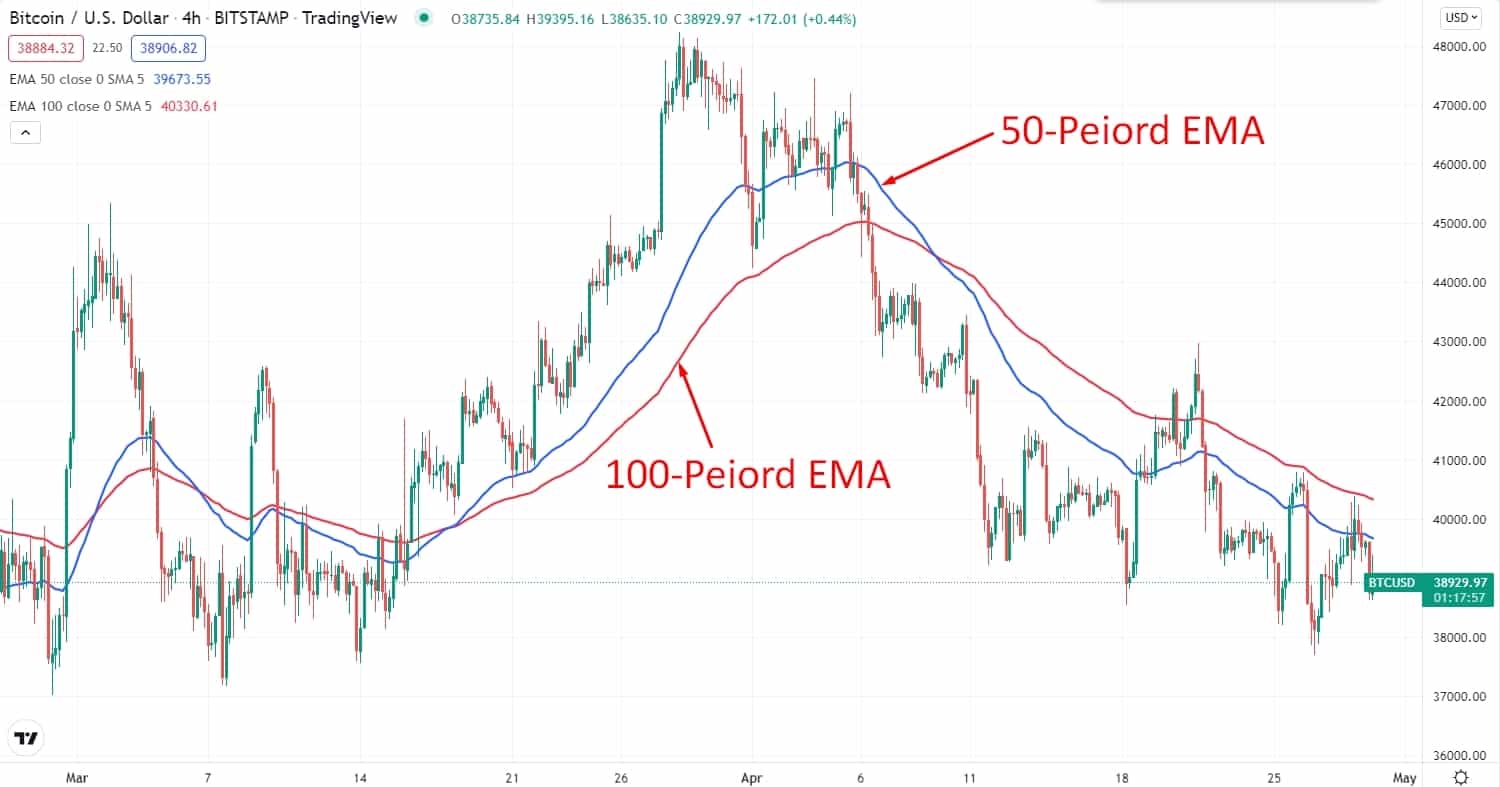
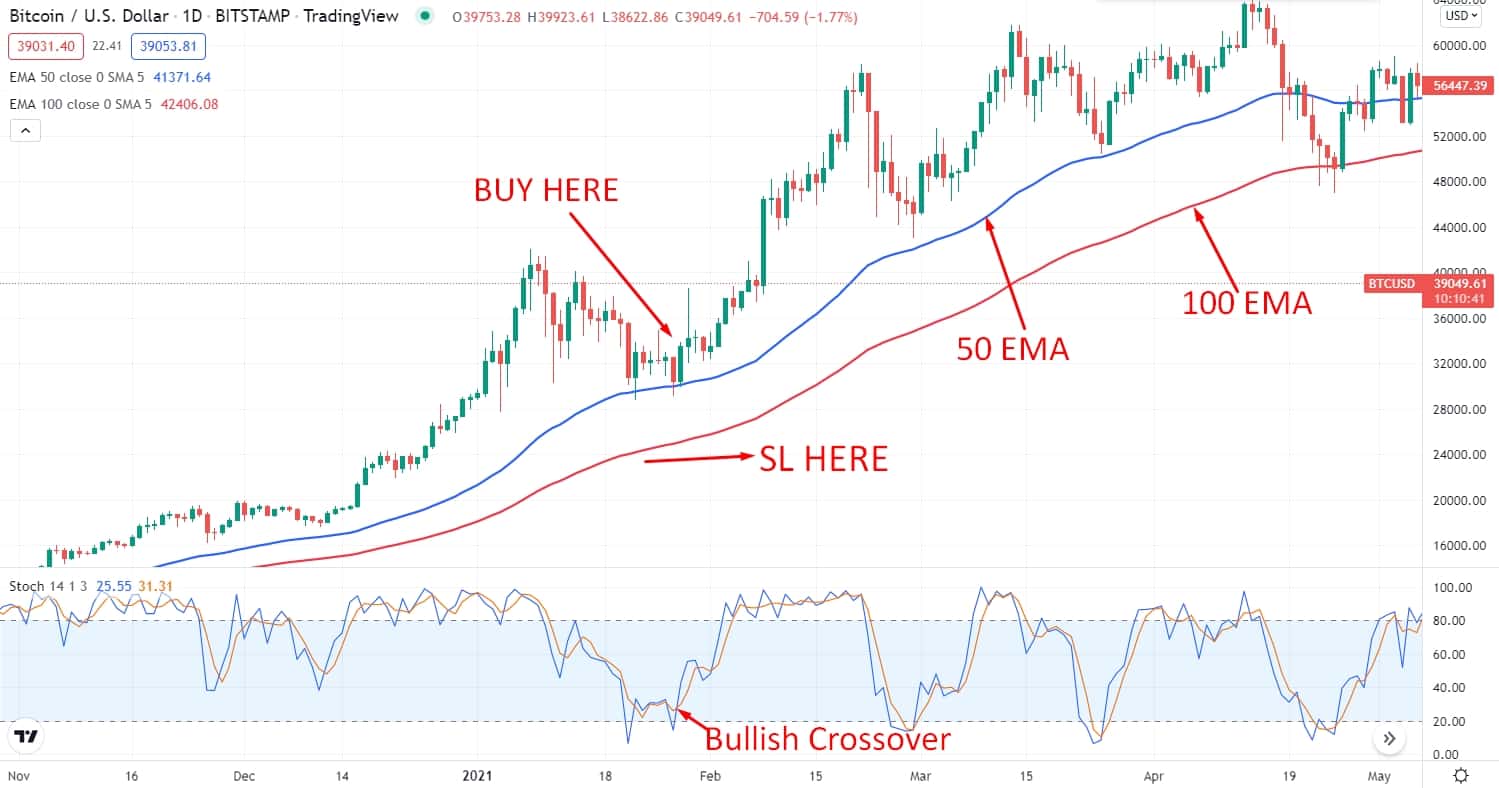
A long-term DEMA crypto trading strategy has been developed based on the 2 EMA’s, one is a 50-period exponential moving average, and another one is a 100-period exponential moving average. Additionally, we are going to add the stochastic oscillator indicator to increase our trade accuracy. Moreover, this strategy will apply to the H4 and D1 time frames.
Bullish trade scenario
Long-term bullish trade scenario
Entry
To enter a buy trade, you must first identify a non-volatile bullish trend in the market. Then look for the price to retrace to the 50-period EMA and have an impulsive bullish candle close above it. Besides, the stochastic oscillator has a bullish crossover near the oversold level of 20.
Stop-loss
Place the stop loss order below the 100-period EMA with at least a 10-15 pips buffer.
Take profit
Take the profit by calculating at least a 1:3 risk/reward ratio.
Bearish trade scenario
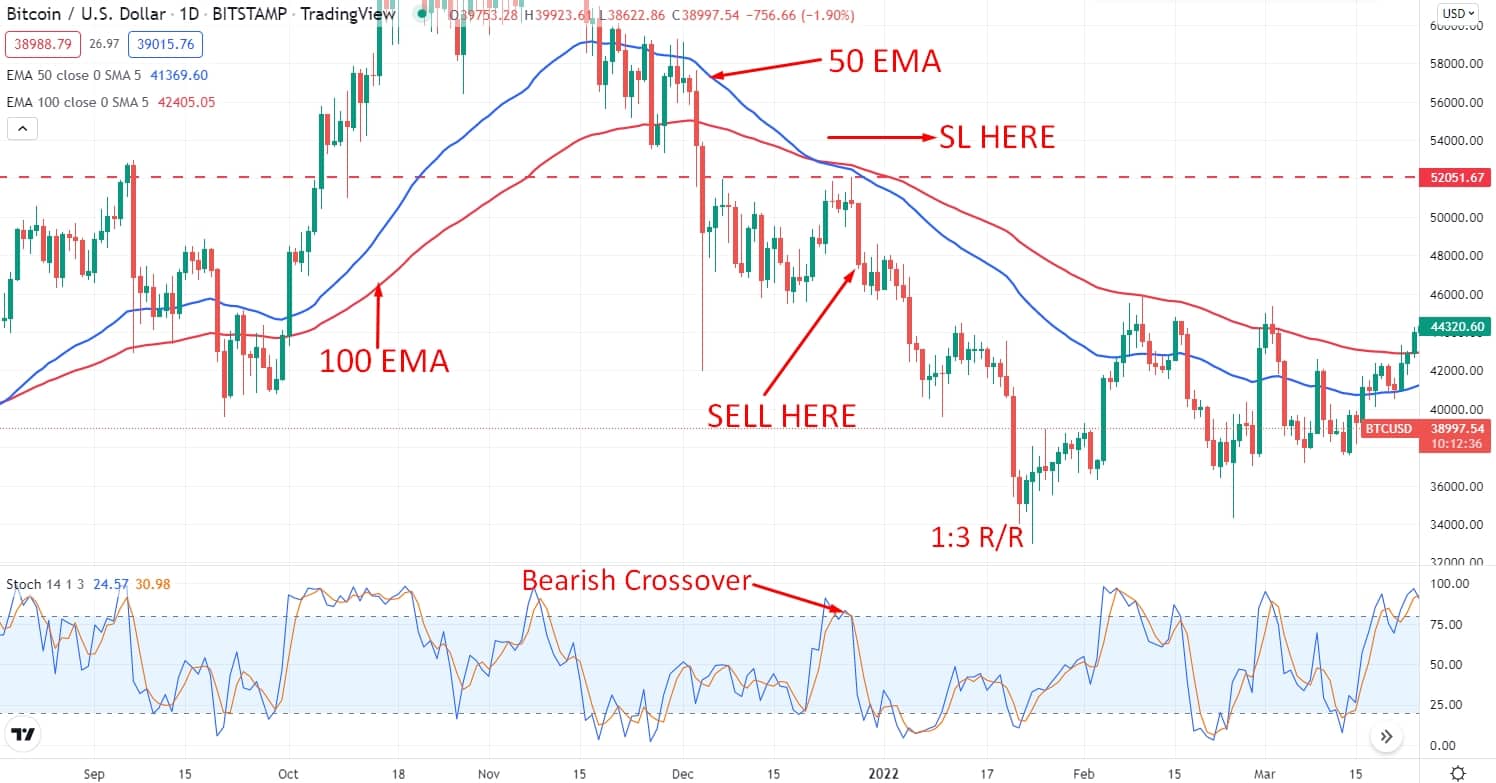
Long-term bearish trade scenario
Entry
To enter a sell trade; first, you have to identify a non-volatile bearish trend in the market. Then look for the price to retrace back to the 50-period exponential moving average and have an impulsive bearish candle close below it. Besides, the stochastic oscillator has a bearish crossover near the overbought level of 80.
Stop-loss
Place the stop loss order above the 100-period EMA with at least a 10-15 pips buffer.
Take profit
Take the profit by calculating at least a 1:3 risk/reward ratio.
Pros & cons
| Pros | Cons |
|
|
|
|
|
|
Final thoughts
Finally, investors and traders have utilized MAs in their market analysis for many years. It is a technical analysis tool widely utilized intending to rapidly identify and decipher the longer-term trend of a particular trading instrument.
Although MAs are inherently lagging indicators, they are beneficial for adjusting the moving average to calculate a quick-witted and more receptive indicator. However, The DEMA benefits traders and investors by considering a longer-term trend, along with the prepend power of being a MA that is swift but has less lag time.


Comments