
The advance/decline line is a technical indicator measuring the market conditions’ overall robustness, implying whether any available cryptos are climbing upwards or dipping downwards. It also measures whether most cryptos are trending the market in the opposite direction. Moreover, it may provide significant insight into analyzing the market trends.
The indicator is beneficial for determining in which direction and how strongly the market is trending. It also gives hints for the potential future direction of the market in the short term.
The following section will see the complete advance-decline line crypto strategy guide that includes exact buying and selling trading methods.
What is the advance/decline line?
It is an indicator used in technical analysis, also known as the A/D line. The advance/decline line indicates the difference between the daily moving along and the falling number of assets is indicated by the advance/decline line. If a positive number keeps adding to the previous number or the negative number gets subtracted from the earlier number, the indicator increases.
However, the advance/decline line is utilized to depict the market’s sentiment since it indicates whether there are any more increasing or decreasing assets available or not. It helps in the confirmation of the price trends. Moreover, while the divergence takes place, the advance/decline line can also notify reversals.
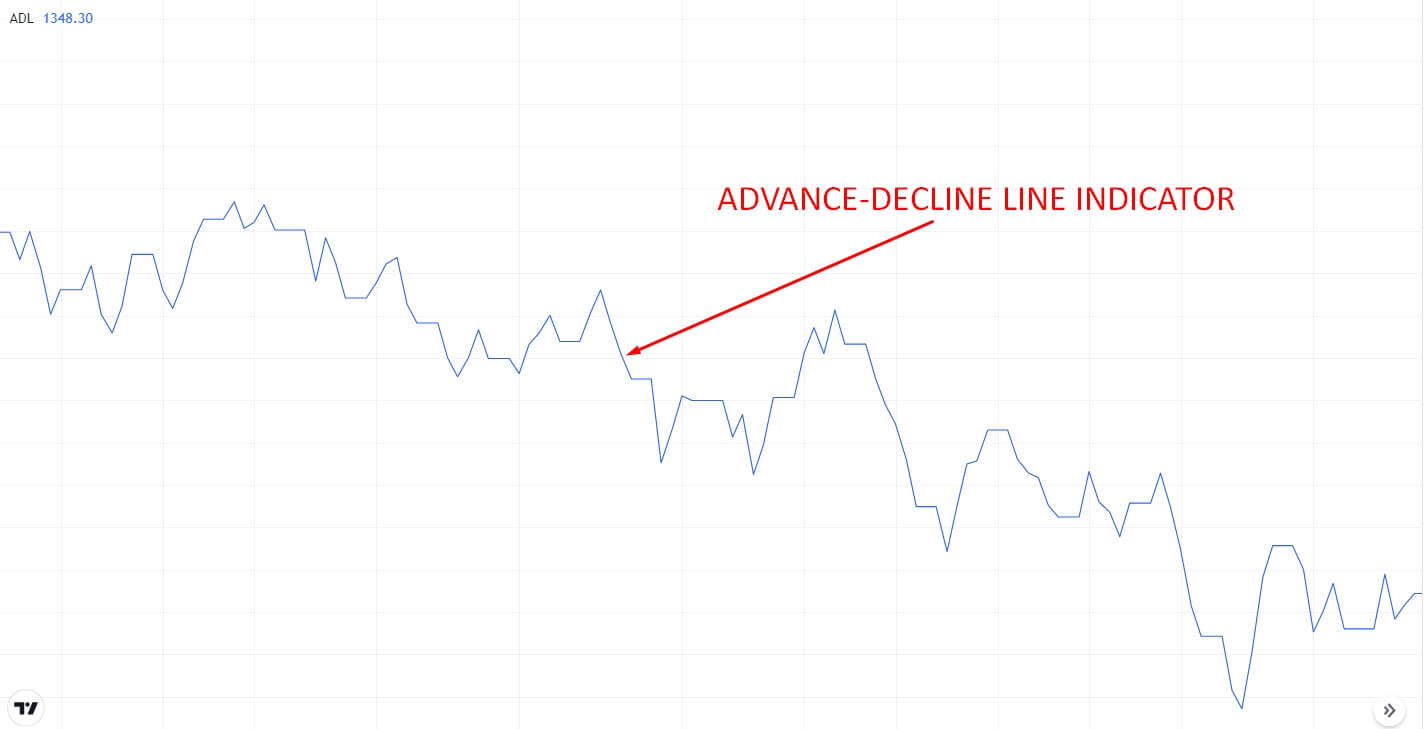
Advance-decline line indicator
How to trade using advance/decline line in trading strategy?
The advance/decline line helps confirm the robustness of a current trend and its reversing probability. The indicator indicates whether most cryptos are joining in the market direction.
If the cryptos are moving upwards yet the A/D line sloping downwards, it is called bearish divergence. Bearish divergence hints that the markets are dropping their breadth and perhaps intending to reverse direction. On the other hand, the A/D line slope and market both are moving upwards, which means the market is in a sound and healthy condition
On the contrary, if the cryptos keep on moving downwards and the A/D line has turned upwards, a bullish divergence may indicate the seller’s losing conviction. If the slope of the A/D line is lower and the market is also trending lower, there is a high chance of continuing the price decline.
A short-term trading strategy
It has developed based on the market trend and shorter retracements on the lower time frames like M5 and M15. In this trading strategy, we will use the indicator to identify the strength of the market. Besides, we are going to use the 100 EMA indicator to understand the market momentum. Moreover, we will apply this trading method to the M5 and M15 time frames.
Bullish trade scenario
First, we must add the A/D and the 100 EMA on the chart. Then, draw a support level and wait for the price to retrace back to the support level and close above the 100 EMA.
- 100 EMA adds more confluence by holding the price as strong support.
- The advance-decline line is moving upside to indicate upcoming bullish pressure.
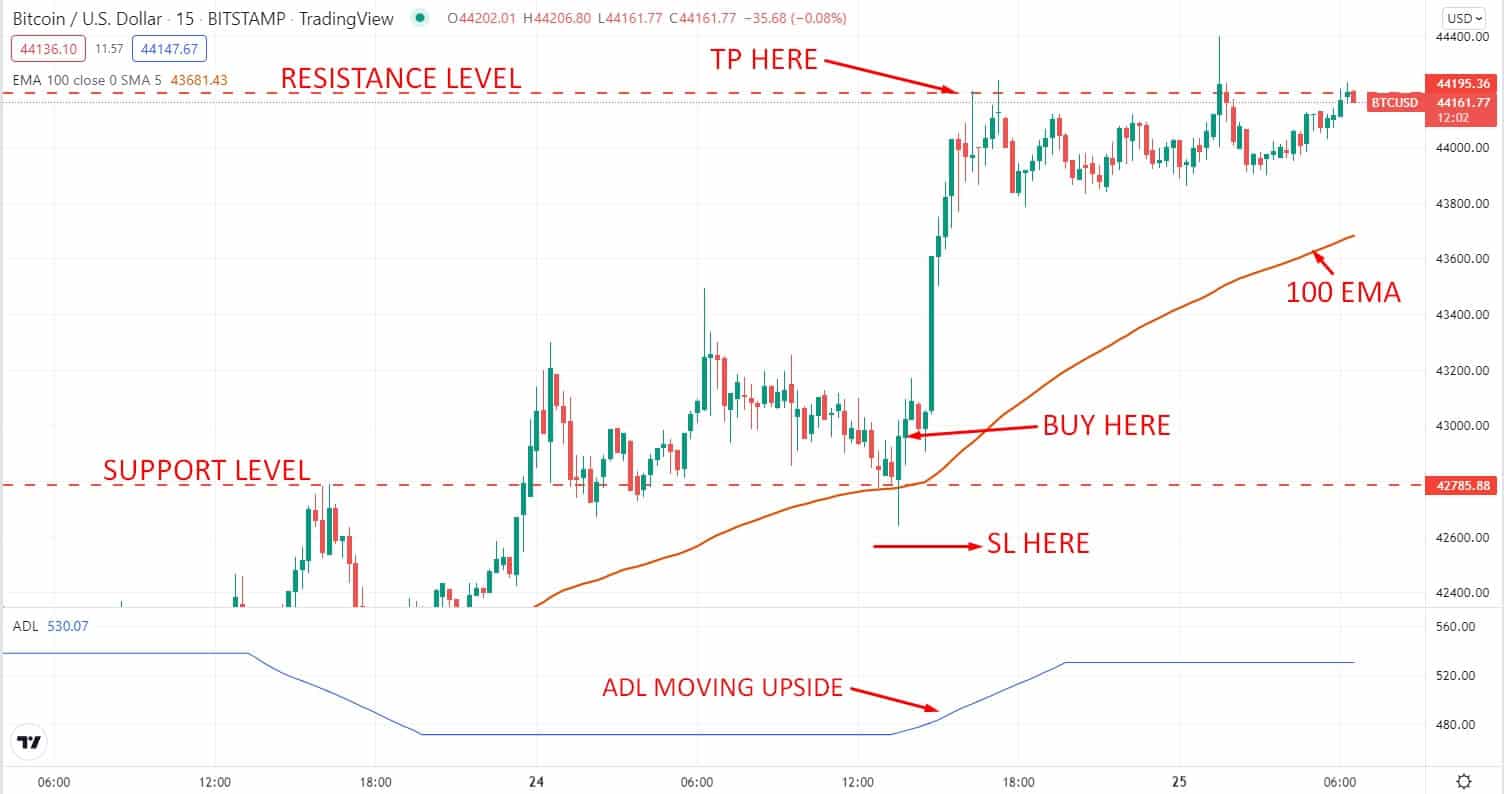
Short-term bullish trade scenario
Entry
Enter a buy trade when the price had an impulsive bullish candle close after bouncing from the support level.
Stop-loss
Place the stop loss order below the support level with at least a 5-10 pips buffer.
Take profit
Set the take profit order at the upcoming resistance level. Or else, you can take the profit by calculating the 1:3 risk/reward ratio.
Bearish trade scenario
First, we have to add the advance-decline line indicator and the 100 EMA indicator on the chart. Then, draw a resistance level and wait for the price to retrace back to the resistance and close below the 100 EMA.
- 100 EMA adds more confluence by residing above the price.
- The advance-decline line is moving down to indicate upcoming bearish pressure.
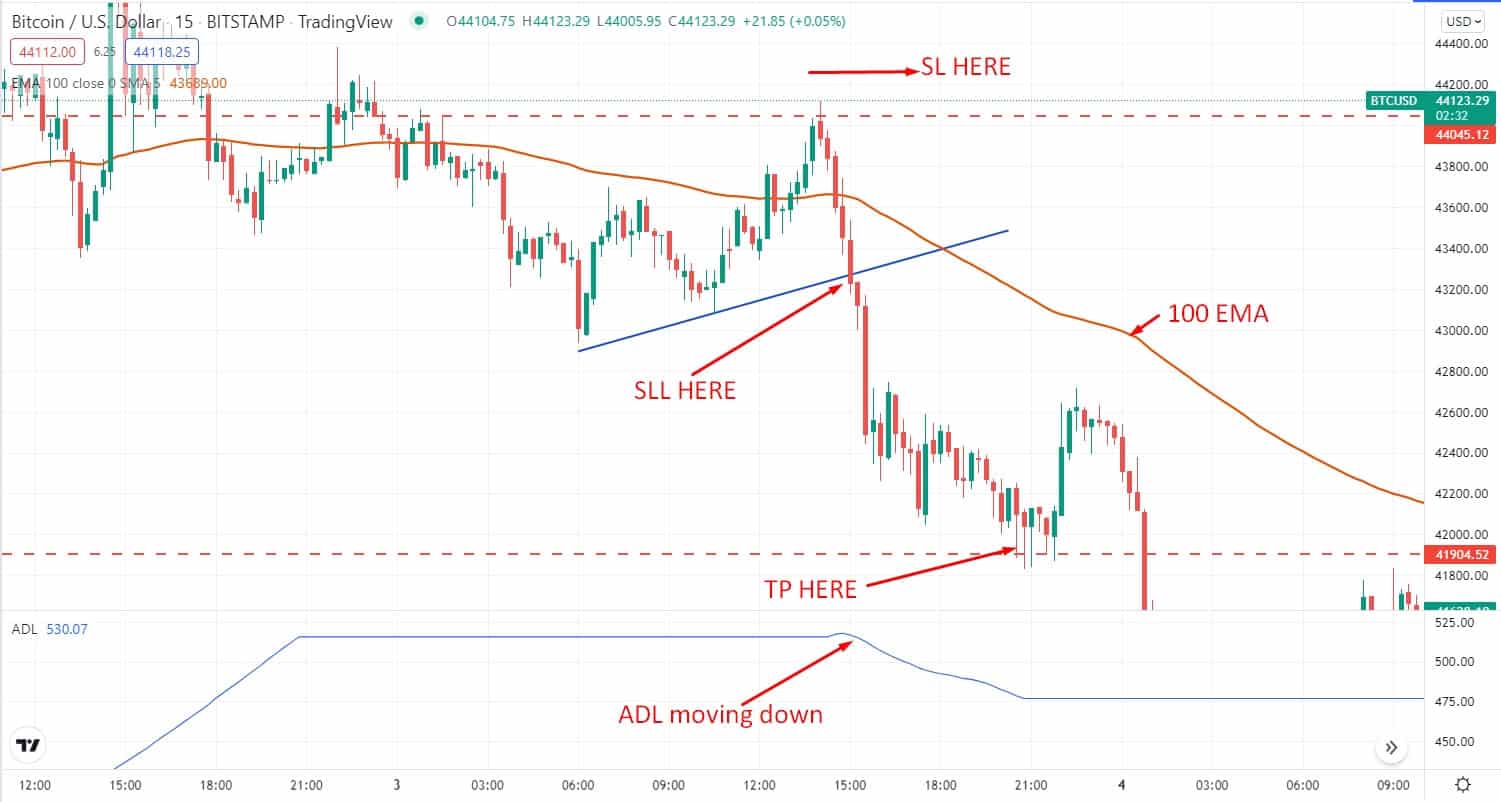
Short-term bearish trade scenario
Entry
Enter a sell trade when the price had an impulsive bearish candle close after rejecting from the resistance level.
Stop-loss
Place the stop-loss order above the resistance level with at least a 5 – 10 pips buffer.
Take profit
Set the take profit order at the upcoming support level. Or else, you can take the profit by calculating the 1:3 risk/reward ratio.
A long-term trading strategy
It has developed based on market divergence. In this trading strategy, we will use the indicator to identify the divergence of the market. Besides, we are going to use the 20 EMA indicator to understand the market momentum. Moreover, we will apply this trading method to the H4 and D1 time frames.
Bullish trade scenario
First, we have to add the advance-decline line indicator on the chart. Besides, we will use the 20 EMA to understand the market momentum and identify the entry point.
- The advance-decline line will help us to identify the bullish divergence of the market.
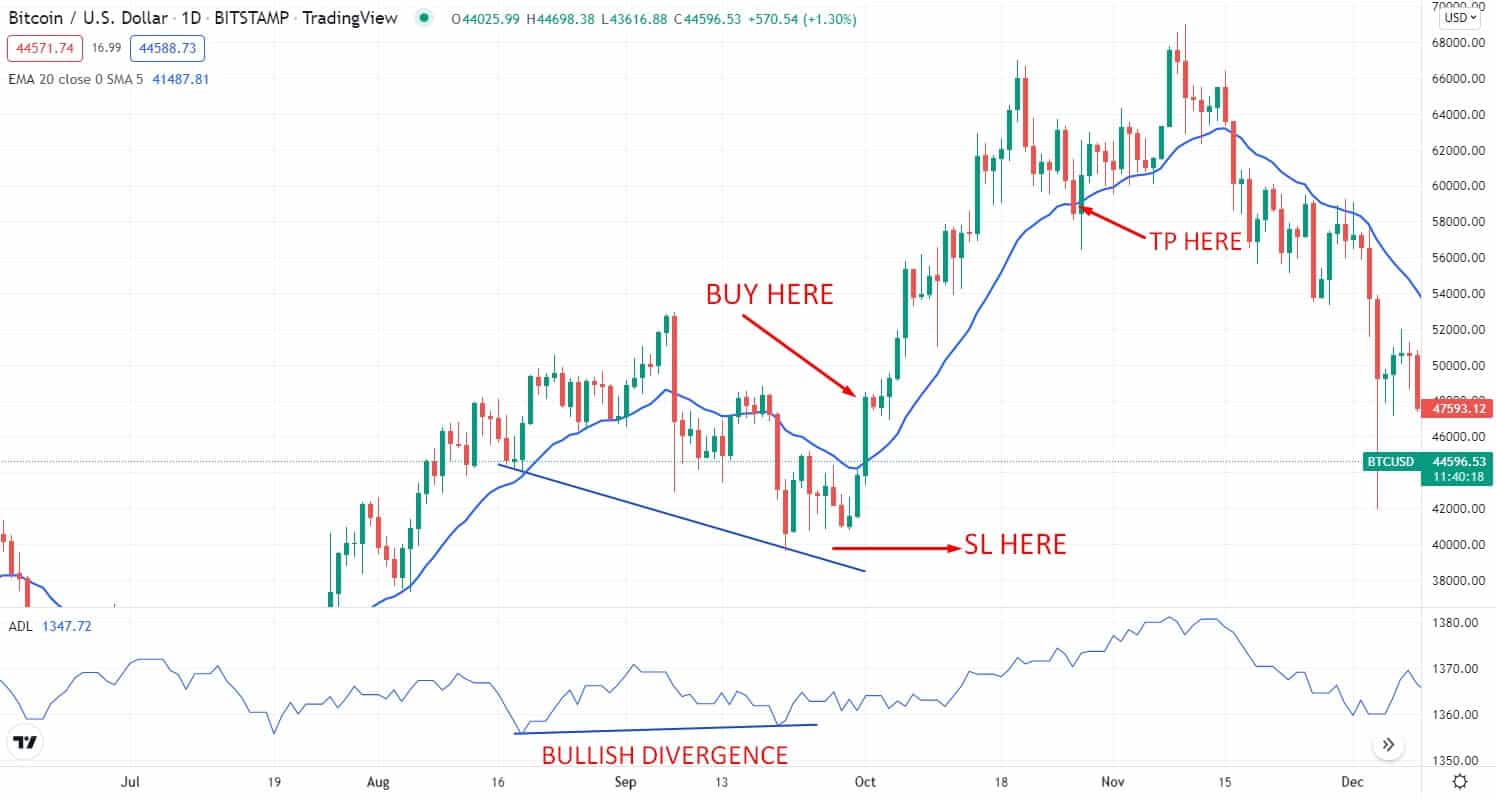
Long-term bullish trade scenario
Entry
Open a buy trade when the price had an impulsive bullish candle close above the dynamic level of 20 EMA after creating a bullish divergence.
Stop-loss
Place the stop loss order below the last swing level with at least a 10-15 pips buffer.
Take profit
Take the profit by calculating at least a 1:3 risk/reward ratio. Or, you can take the profit when the price has a bearish candle close below the 20 EMA.
Bearish trade scenario
First, we must add the indicator on the chart. Besides, we will use the 20 EMA to understand the market momentum and identify the entry point.
- The advance-decline line will help us to identify the bearish divergence of the market.
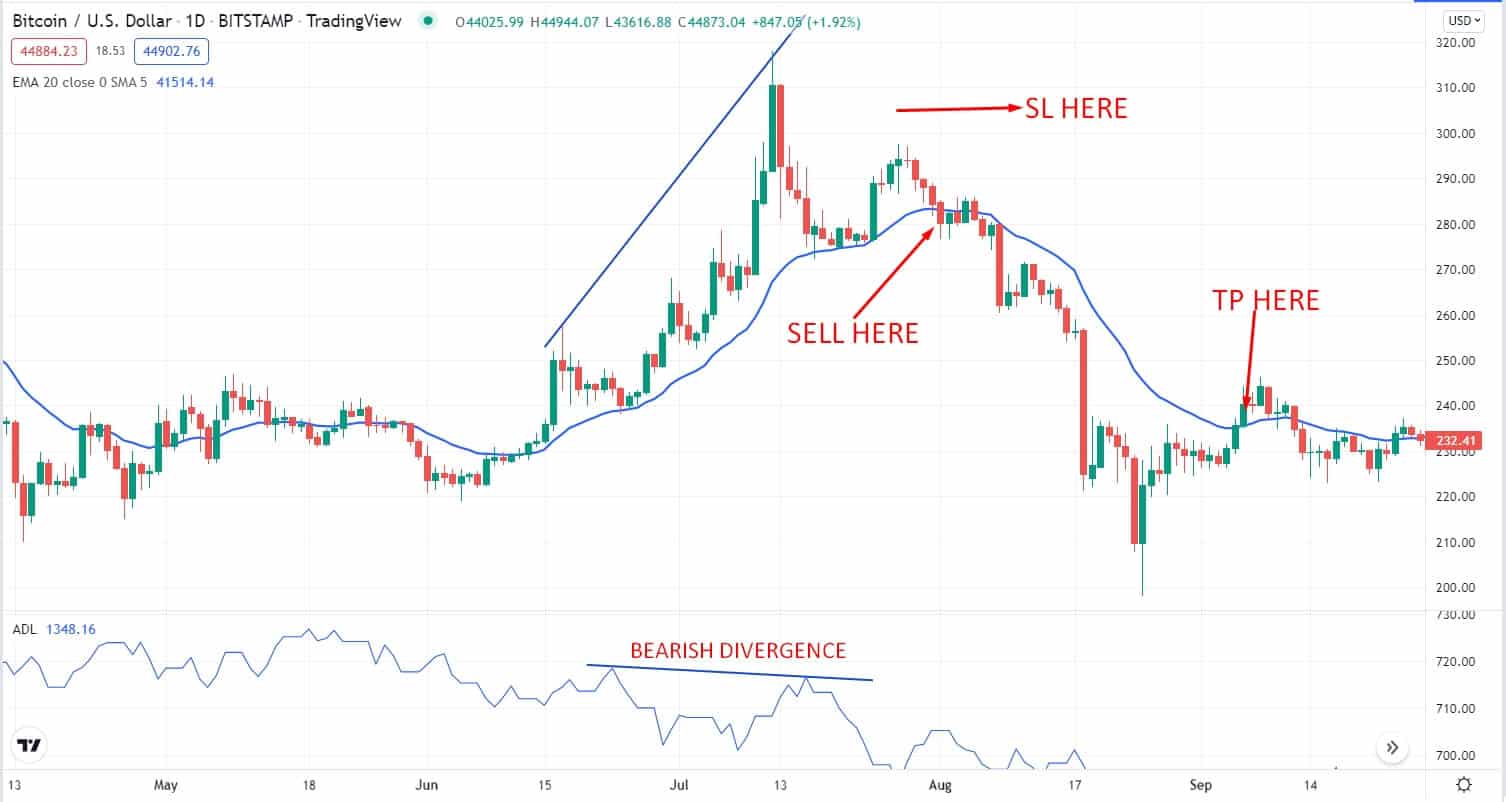
Long-term bearish trade scenario
Entry
Open a sell trade when the price had an impulsive bearish candle close below the dynamic level of 20 EMA after creating a bearish divergence.
Stop-loss
Place the stop-loss order above the last swing level with at least a 10-15 pips buffer.
Take profit
Take the profit by calculating at least a 1:3 risk/reward ratio. Or, you can take the profit when the price has a bullish candle close above the 20 EMA.
Pros and cons
| 👍 Pros | 👎 Cons |
|
|
|
|
|
|
Final thoughts
Finally, the advance/decline line is an indicator utilized in predicting the direction to know the overall market position. It is a popular market indicator that helps in predicting and confirming trends. Also, the A/D offers notifications of market reversals. It provides extraordinary graphical guidance that may support traders in decision-making on short-term market strategies and positions. Nonetheless, it is significant to be aware of this line’s downsides and exploit the benefits and gain a better outcome.


Comments