According to technical analysis, when the price of an asset moves over the resistance zone or under the support zone, it is called a breakout. It may depict that the asset’s price trend may onset in the breakout’s direction.
While there is a high volume, the chances of continuing the breakout are high. However, if it goes alongside the high volume can be deemed as a more robust signal than the average volume breakout. Also, breakouts may occur due to the range, price pattern, or channel. Typically, breakouts are started by a diminished volatility period.
What is a crypto breakout?
Breakout is the price of a crypto that goes outward of an interpreted support or resistance level and an escalated volume. If the crypto price breaks over the resistance level, then a trader opens a long position. On the contrary, if the price breaks under the support level, the trader opens the short position. The trader who trades based on the breakouts is known as a ‘breakout trader’.
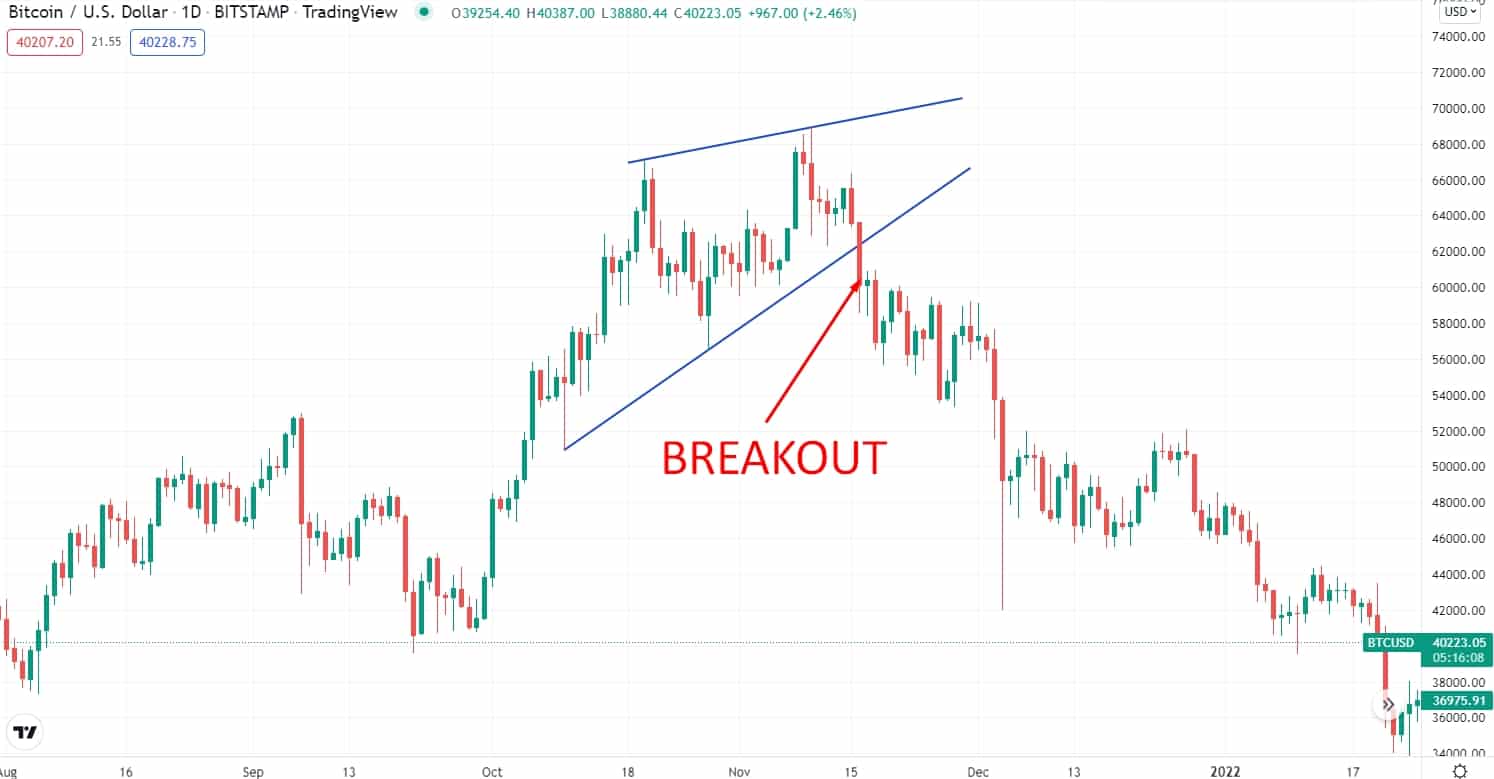
Pattern breakout
Moreover, when the crypto trades overcome the price blockade, volatility prefers to go upwards. Also, the prices trend in the direction of a breakout. Breakouts strategy is the basic assumption for the future large price swings, volatility expansions, and crucial price trends. Hence, the strategy holds great significance. However, breakouts take place in various market environments.
Commonly, the intense price movements are a consequence of price patterns and channel breakouts. It will usually enlarge after prices move far from the interpreted ranges since the volatility contracts during these time frames.
How to trade using crypto breakout?
Regarding trading breakouts, paying heed to the cryptos’ fundamental support and resistance levels is crucial. If a crypto price hits these areas, the levels become significant. The more it hits those levels, the more influential they turn. Simultaneously, while the crypto price finally breakouts, it may deliver a better outcome while these support and resistance levels stay longer in the play.
Moreover, different price patterns may take place on the price chart and the price consolidation. The structures like triangles, flags, and channels are worthy vehicles searching for crypto to trade. Apart from patterns, stability and the time duration that crypto price has kept to its support or resistance levels are influential factors to pay attention to when looking for a good opportunity for trading.
A short-term trading strategy
This strategy has been developed based on the market’s price range in the lower time frames. We must identify the squeezes in the lower time frames and wait for entry when the price breaks above or below that range.
Moreover, this short-term ultimate crypto breakout trading strategy will be based on the pure price action; we will not use any indicator in this trading method. However, this strategy will apply to the M5 and M15 time frames.
Bullish trade scenario
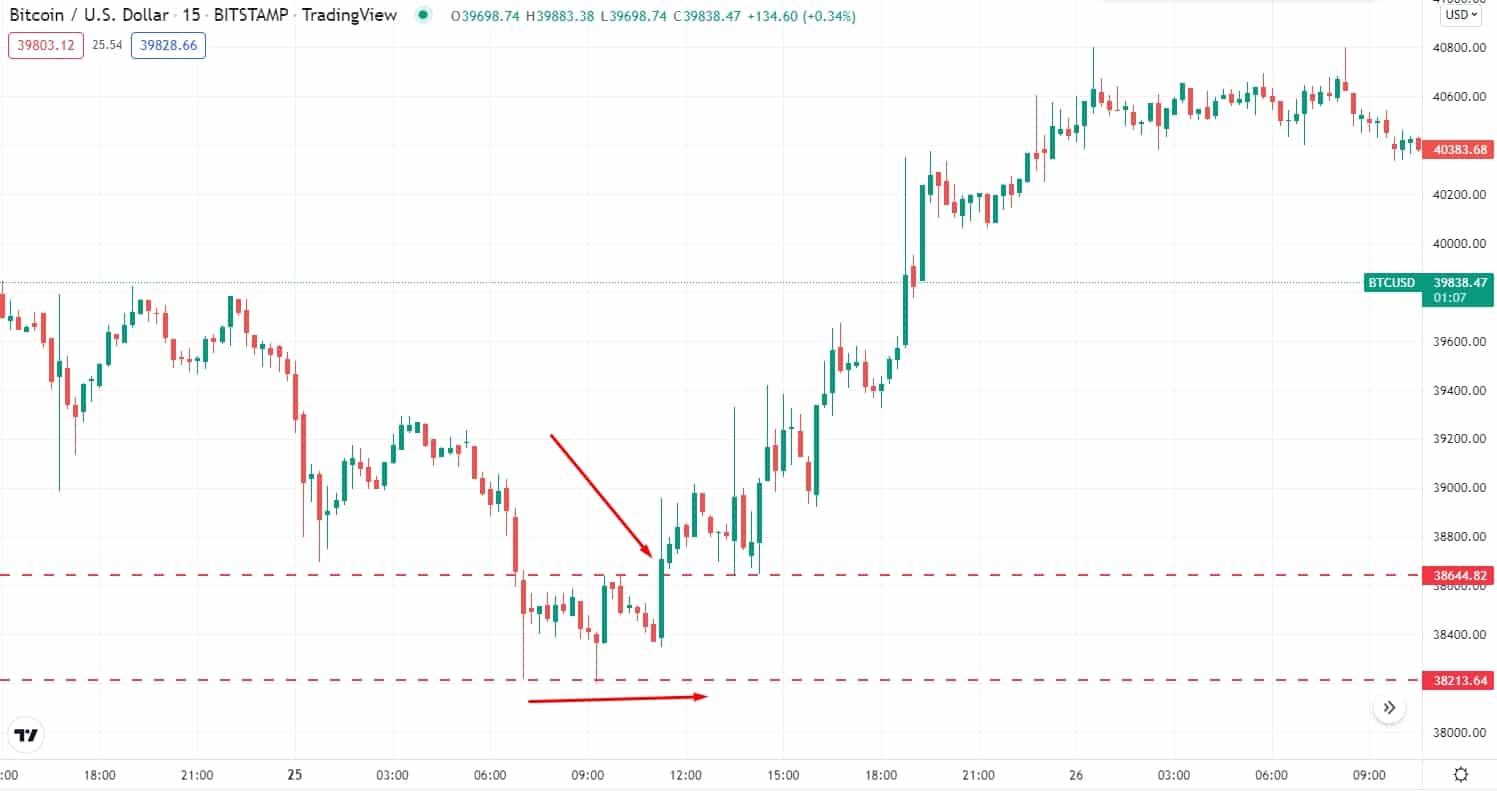
Short-term bullish trade scenario
Entry
Enter a buy trade when the price breaks above the range area with an impulsive bullish candle close.
Stop-loss
Place the stop loss order below the range with at least a 5-10 pips buffer.
Take profit
Take the profit by calculating at least a 1:3 risk/reward ratio. Otherwise, you can take the price by targeting the upcoming resistance level.
Bearish trade scenario
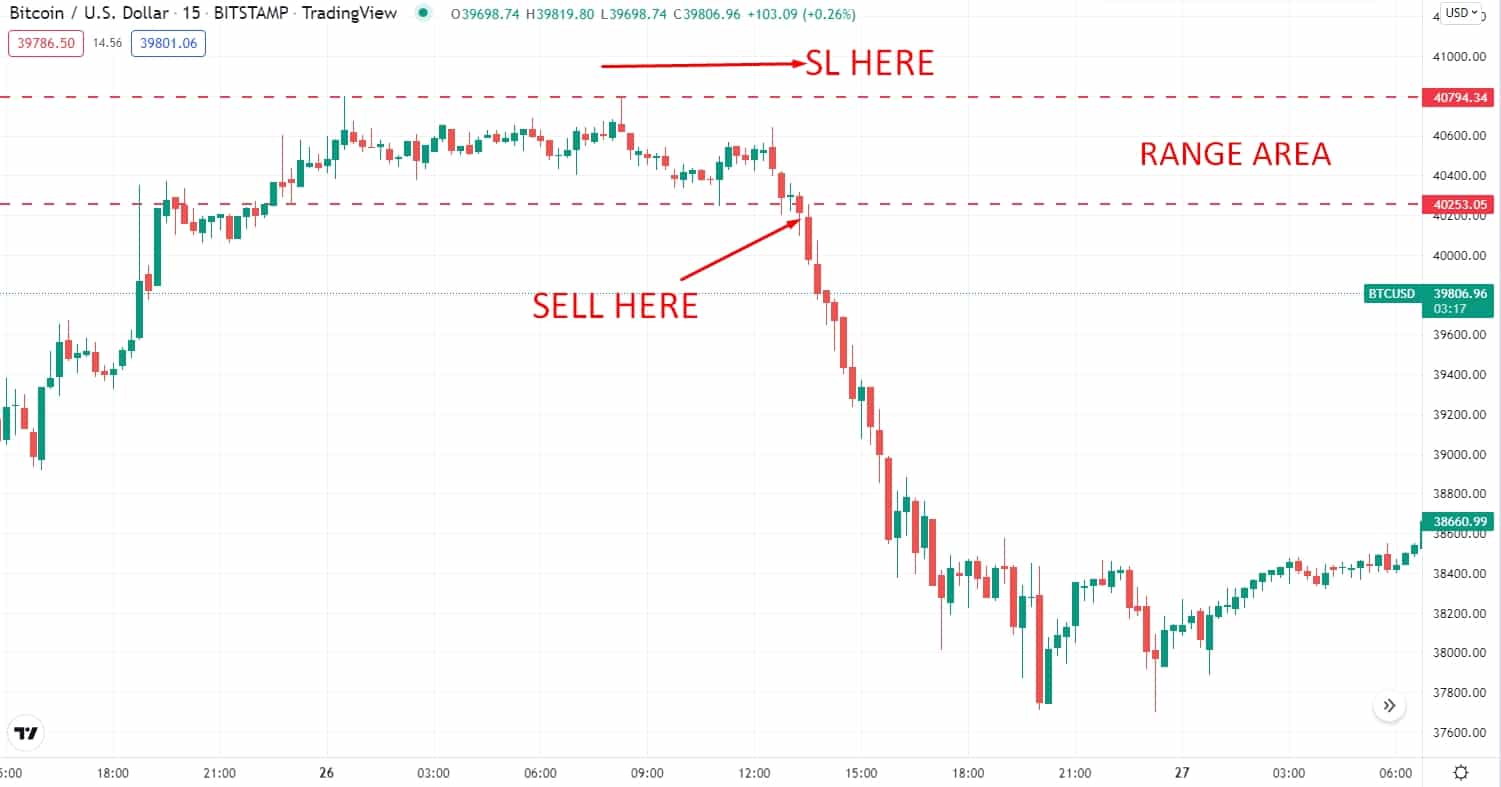
Short-term bearish trade scenario
Entry
Enter a sell trade when the price breaks below the range area with an impulsive bearish candle close.
Stop-loss
Place the stop-loss order above the range with at least a 5-10 pips buffer.
Take profit
Take the profit by calculating at least a 1:3 risk/reward ratio. Otherwise, you can take the price by targeting the upcoming support level.
A long-term trading strategy
This strategy has been developed based on the market patterns in the higher timeframes. In this trading strategy, we are going to add one indicator, which is a 20-period exponential moving average to identify the better entry and exit points. Moreover, this strategy will apply to the H4 and D1 time frames.
Bullish trade scenario
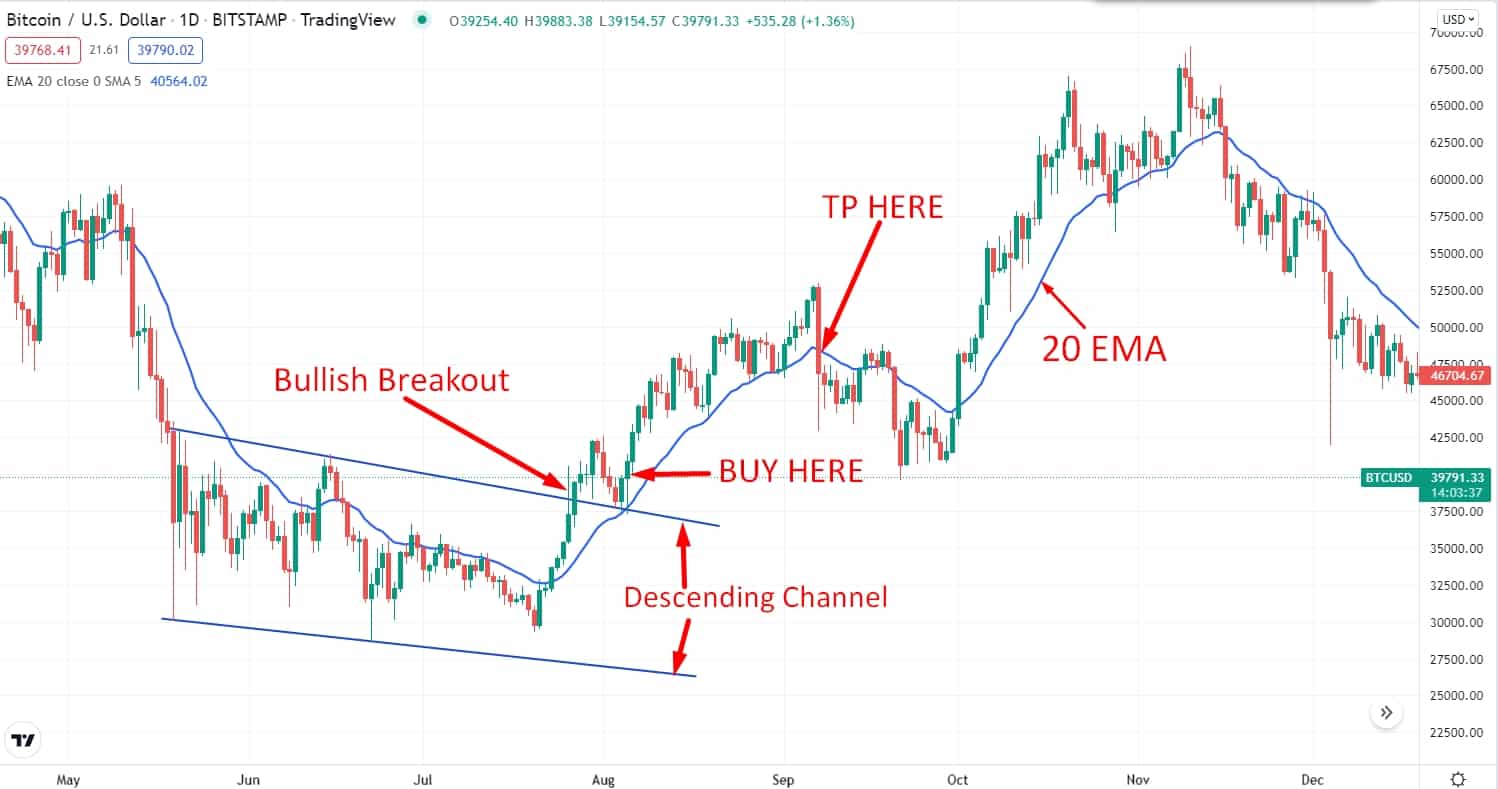
Long-term bullish trade scenario
Entry
Look for a buy trade when the price breaks above the pattern’s resistance with an impulsive bullish momentum. Open a buy trade when the price returns to the dynamic level of 20 EMA and has a bullish candle close.
Stop-loss
Place the stop loss order below the dynamic level with at least a 10-15 pips buffer.
Take profit
Take the profit by calculating at least a 1:3 risk/reward ratio. Or else, you can take the profit when the price breaks below the dynamic level of 20 EMA with a bearish candle.
Bearish trade scenario
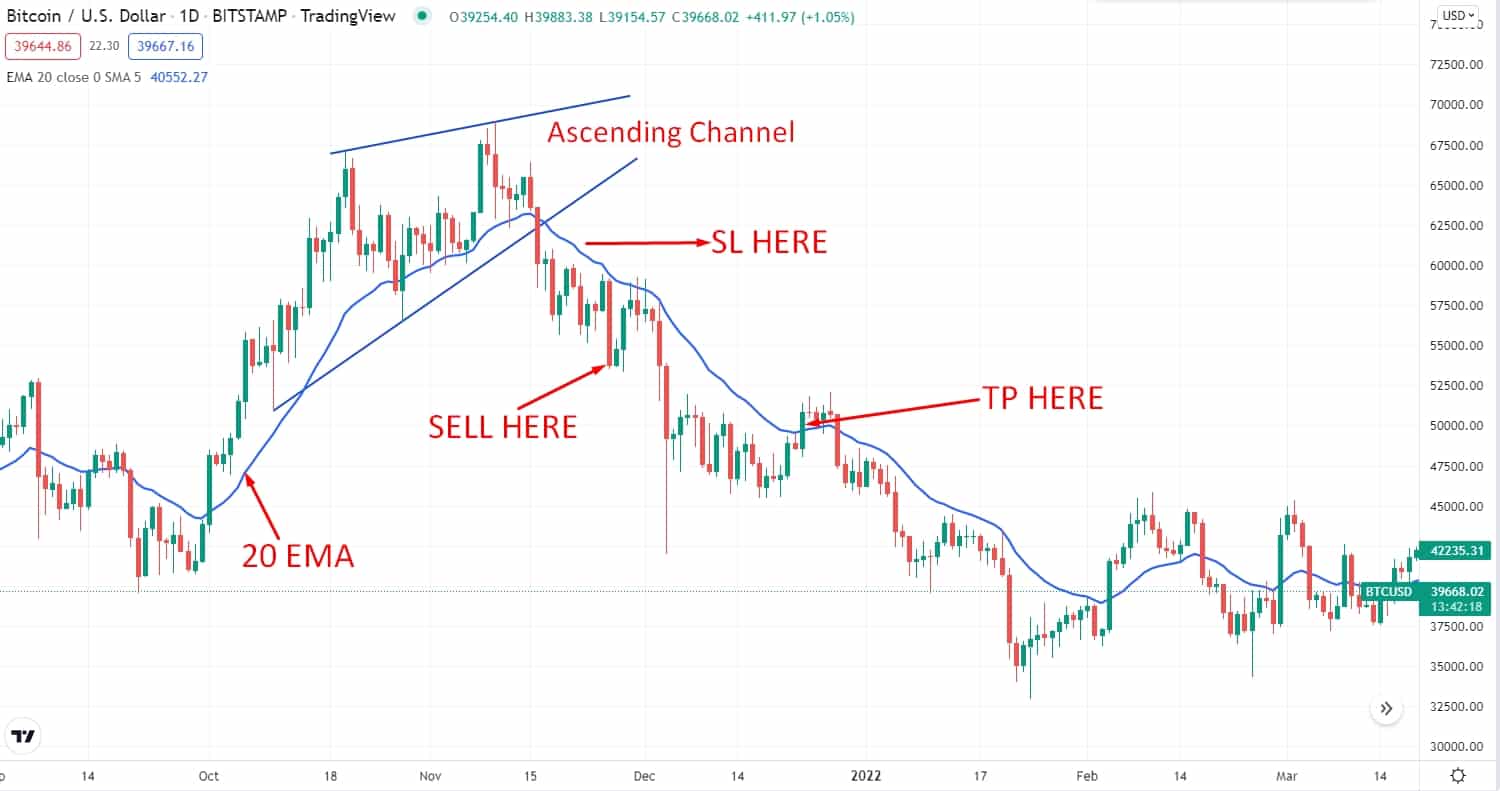
Long-term bearish trade scenario
Entry
Look for a sell trade when the price breaks below the pattern’s support with an impulsive bearish momentum. Open a sell trade when the price retraces back to the dynamic level of 20 EMA and had a bearish candle close.
Stop-loss
Place the stop-loss order above the dynamic level with at least a 10-15 pips buffer.
Take profit
Take the profit by calculating at least a 1:3 risk/reward ratio. Or else, you can take the profit when the price breaks above the dynamic level of 20 EMA with a bullish candle.
Pros & cons
| 👍 Pros | 👎 Cons |
|
|
|
|
|
|
Final thoughts
Finally, breakout trading is embraced with volatility. Since prices are rushing, the volatility encountered after a breakout is credible to initiate emotion. So, you’ll greatly benefit by applying the strides covered in this article. If you can carry it out appropriately, it will also help you draw a trading plan offering massive returns and manageable risk.


Comments