Supertrend tool has proved one of the most highly accurate trend-following indicators for traders. As its name recommends, it is a trend-following tool, implying that it won’t ever give you buy signals when you have an ongoing downward trend.
In contrast to numerous other technical tools, it has not been utilized because most traders don’t have any acquaintance with it or don’t get it. It’s very easy to understand, and a beginner can make profitable entries out of it.
However, both in a downward trend and upward trend, the Supertrend smoothly functions in the trendy market. You can can easily find the change in market direction using this trading tool.
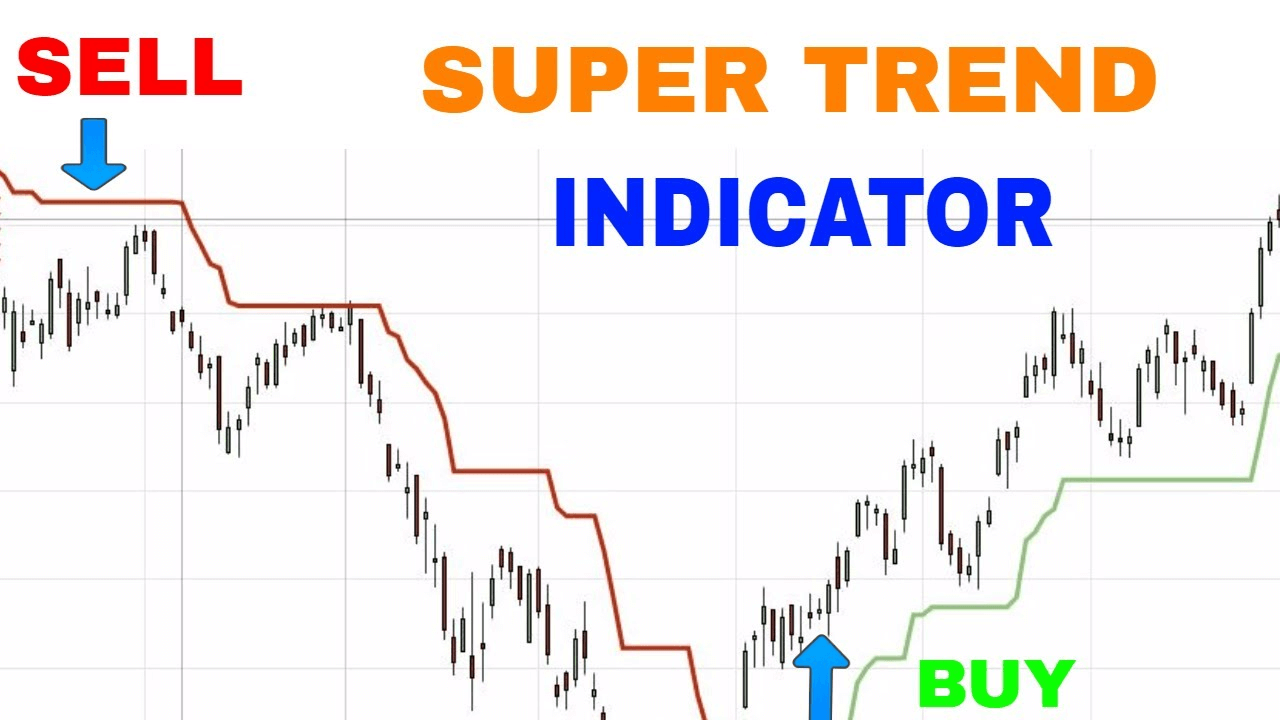
- It shows a buy trade when the indicator closes under the price and its color changes to green.n
- On the contrary, it shows a sell trade when the tool closes over the price and the color of the line changes to red.
This article will give you more ideas about the Supertrend, including how it works and how to use this indicator to improve our trading.
- What is the Supertrend?
- How does the Supertrend indicator work?
- Step 1. Identify Supertrend element
- Step 2. Understanding the market direction
- Step 3. Move higher time frames for better accuracy
- Step 4. Use additional indication for confirmation
- Step 5. Use a strong risk management system
- Pros and cons
- Final thoughts
What is the Supertrend?
It is an MT4, MT5, or Tradingview tool used to define trends. It is created with only two fundamental dynamic values. It is imprinted on the price, and recent trends are easy to identify through the price placement. Moreover, it generates the time to get long and short in currency pairs. Traders can use it over separate periods, M5, D1, W1.
However, the smaller periods may provide high-frequency signals that most change in two colors, green and red.
- The green color signifies that the trend is reversed to the upside, and the red indicates the downside.
- On the contrary, a sell signal is initiated when the tool is portrayed above the closing price, changing from green to red.
If the indicator remains below the price, it will generate a buying possibility.
How does the Supertrend indicator work?
It has two parameters — period and multiplier. But, before getting into the parameter, you must know about the ATR (average true range). ATR is also a trading tool to define the market volatility and, to calculate the value, it blocks the price ranges for a certain time.
However, you only have to check the indicator before choosing the value of the ATR — the number of days and the multiplier. Most of the traders utilize ten periods, with the multiplier being three. A shorter number of trading days may generate more signals. Also, these signals might be more respondents to the price changes. Besides, a long value of trading days can diminish the clash of frequent price actions so that there will be lesser signals for paying heed.
Step 1. Identify Supertrend element
There are mainly two main elements:
- Calculation method
- Multiplier
The period shows the data points to consider for the estimation. Besides, the multiplier is worth utilizing to increase the ATR. Default of the Supertrend indicator is ten as the period and three as the multiplier.
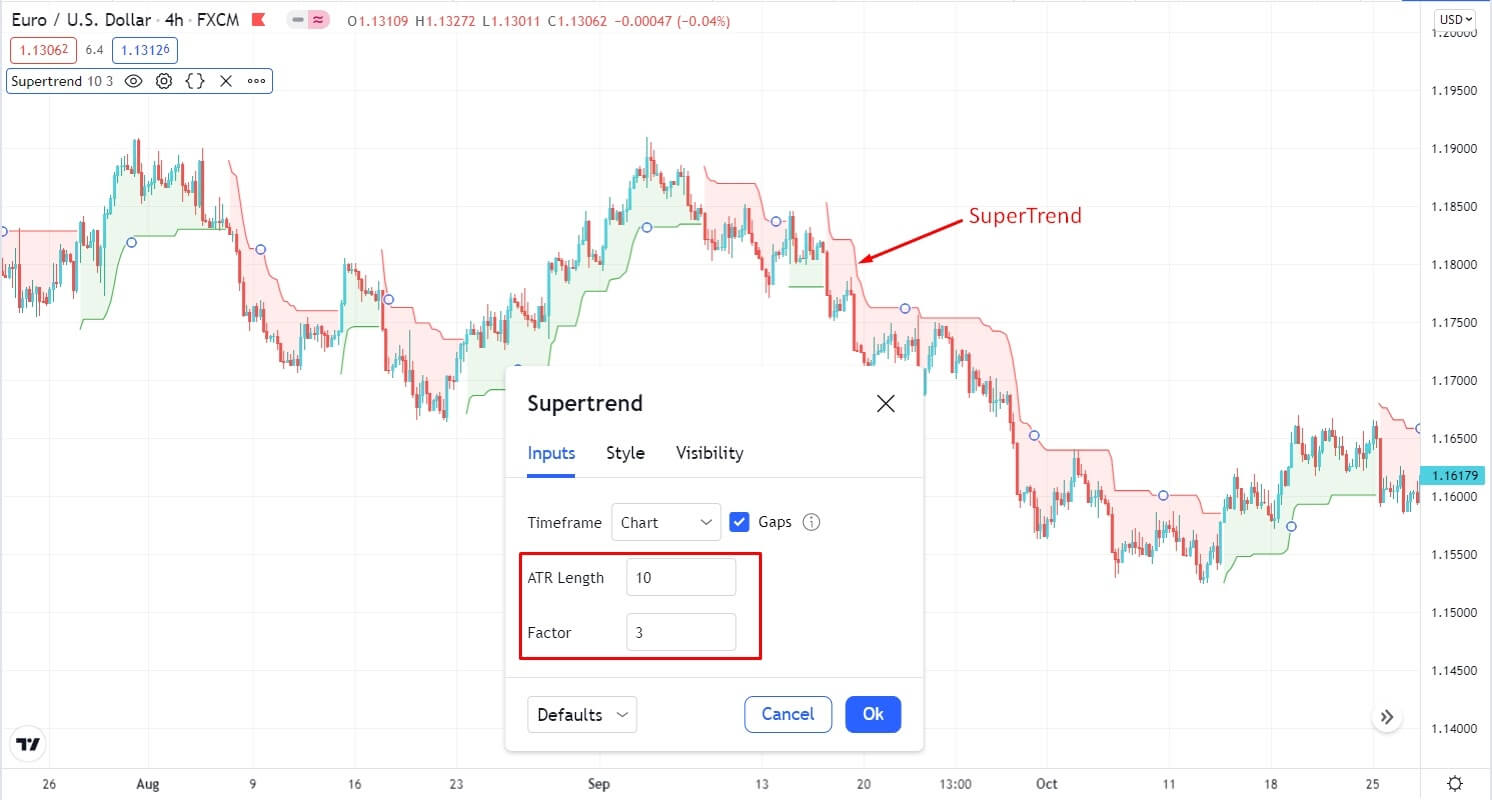
Indicator on chart
Step 2. Understanding the market direction
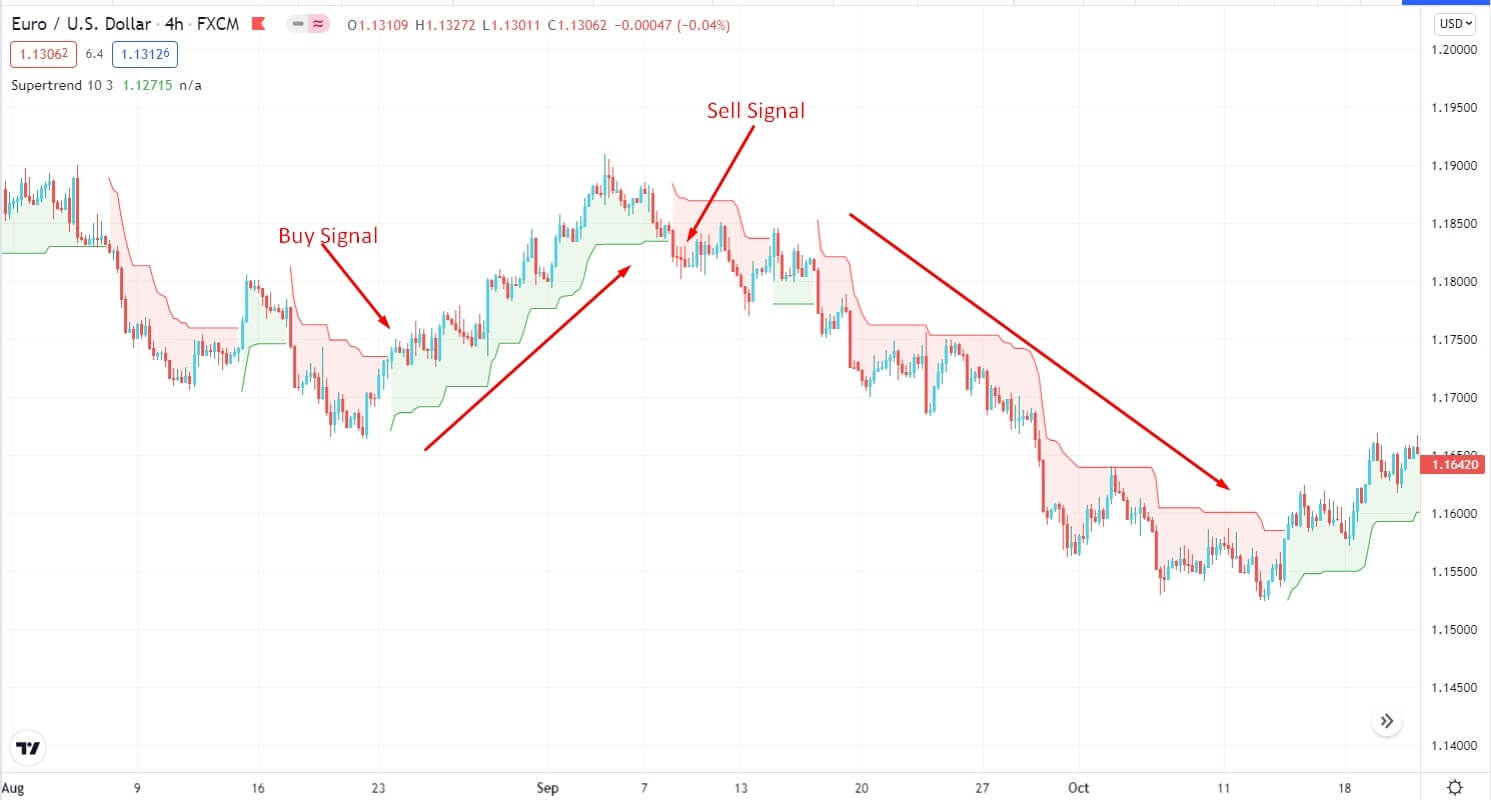
It is very helpful to understand the price sentiment. It provides a buy signal when the color of the indicator changes to green. Besides, it also shows the trend is changing its momentum from bearish to bullish. On the other hand, Supertrend gives a sell signal when the color of the indicator changes into red.
Understanding market direction
Step 3. Move higher time frames for better accuracy
It provides high accuracy trades on higher time frames like H4, D1, W1. The bigger the time frame, the higher will be the accuracy. If we trade based on the higher time frame, our focus will be only to ride the trend to gain more pips. Moreover, you can find good risk/reward ratio trades if you trade on higher time frames.
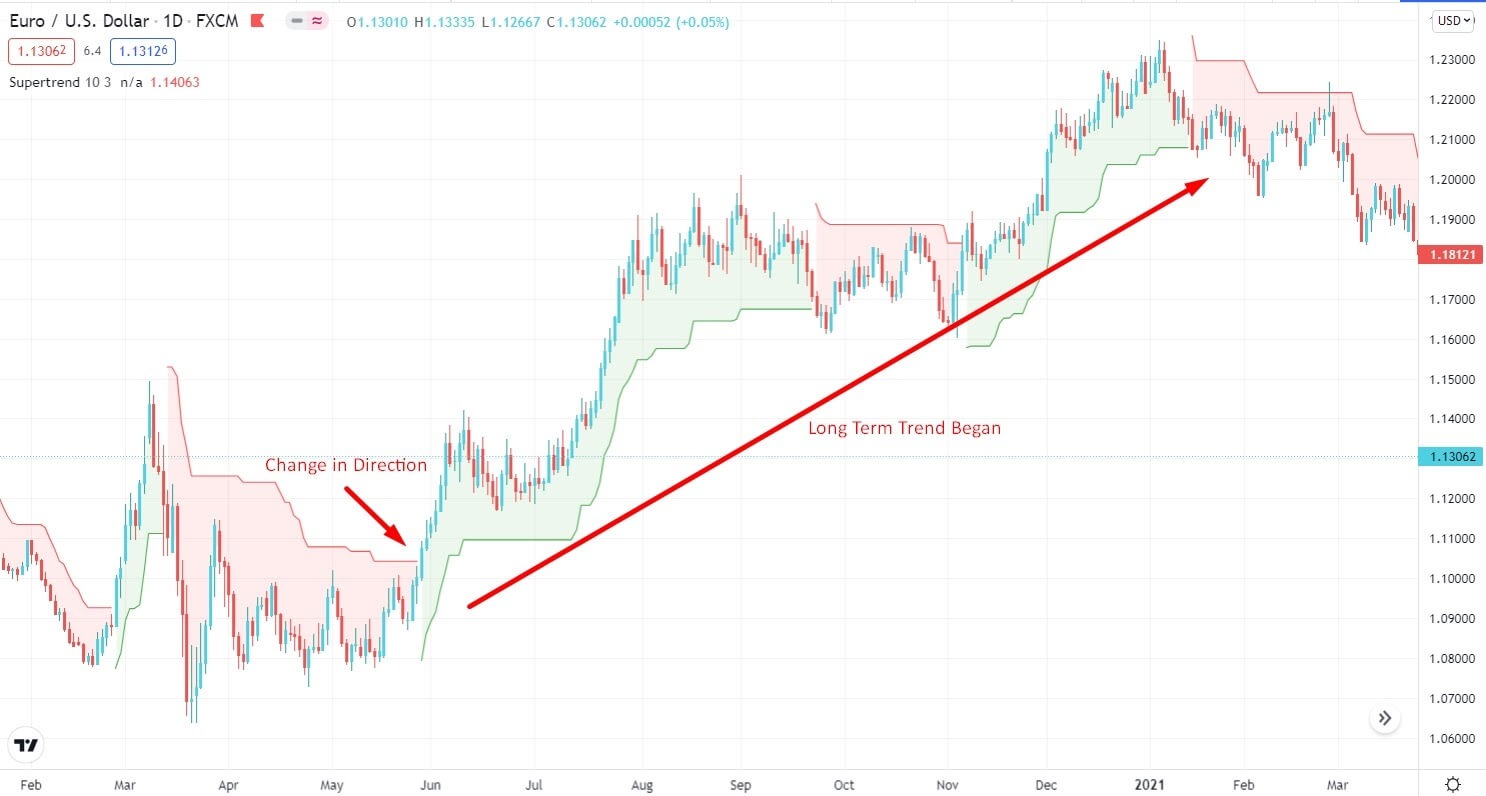
Higher time frame accuracy
Step 4. Use additional indication for confirmation
To confirm the trend direction, you can use other trading tools to increase profitability. Hence, we will add 5 EMA and 20 EMA indicators for good confirmation.
- A buy signal will generate when the 5 EMA crosses over the 20 EMA, and the indicator turns green.
- A sell signal will generate when the 5 EMA crosses below the 20 EMA, and the indicator turns red.
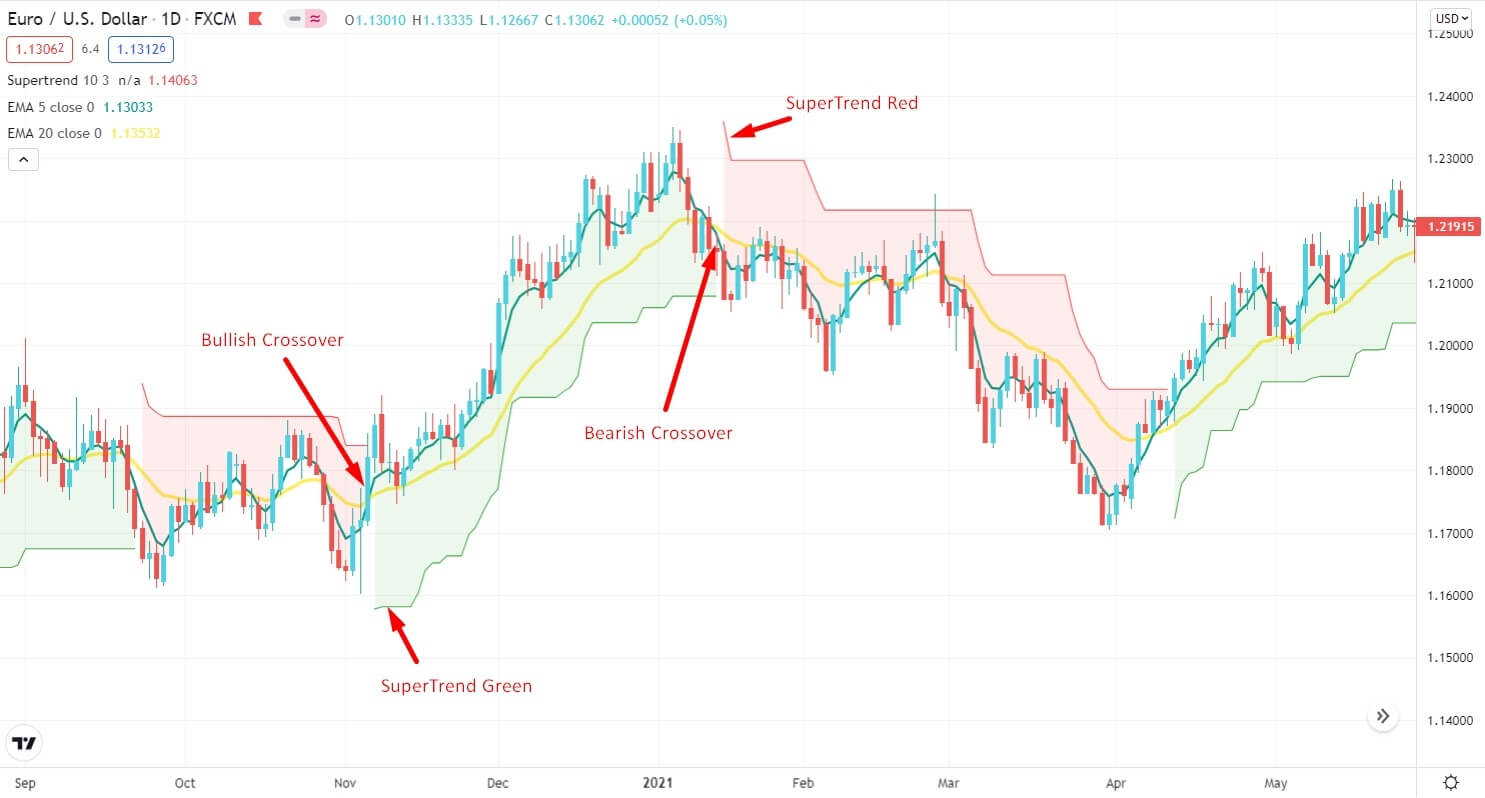
Supertrend with 5, 20 EMA crossover
Step 5. Use a strong risk management system
Risk management is very important in trading. Proper risk management can save your capital from bad trades. Risking more than 2% of your capital will not be good for your trade management. So, always open a trade based on your capital and maintain at least a 1:3 risk/reward ratio.
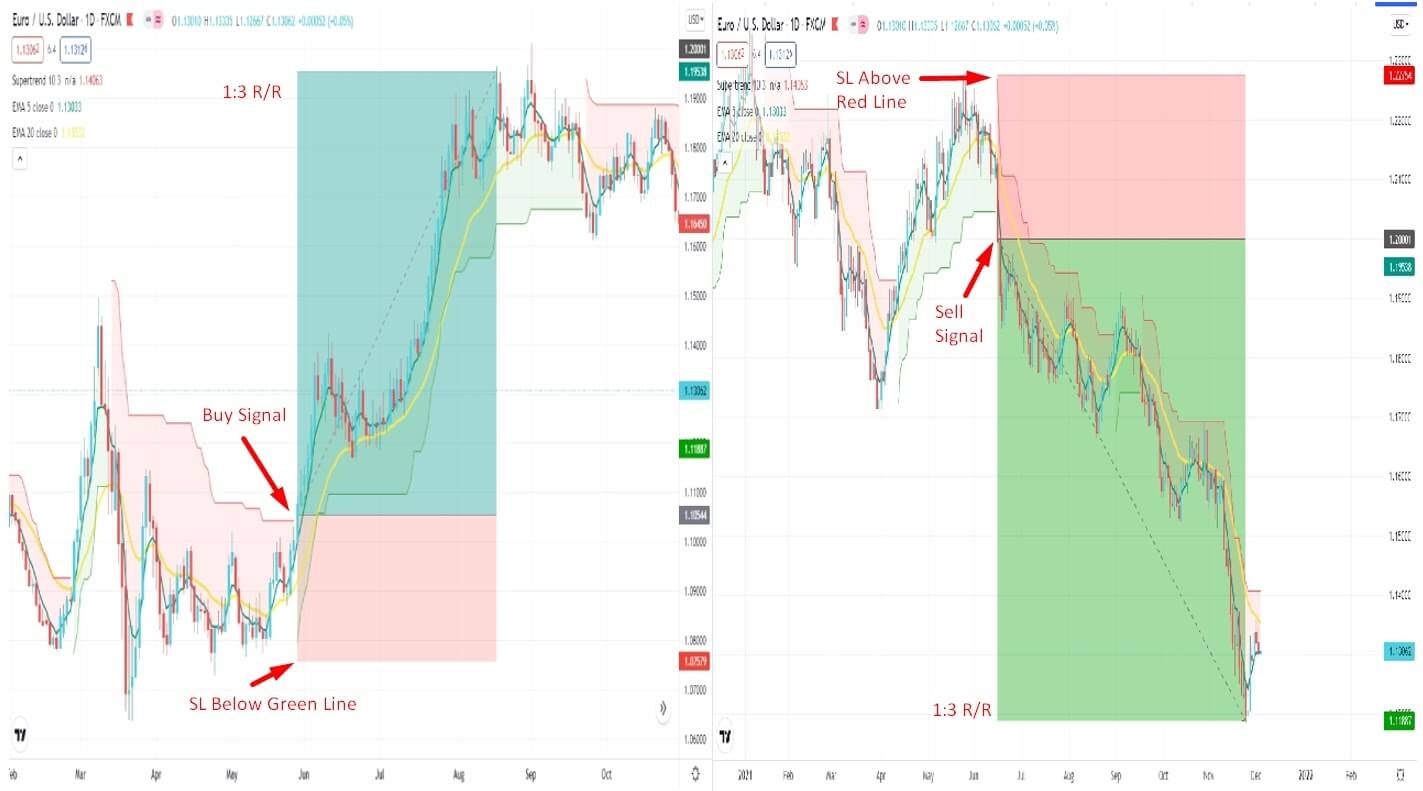
Trade with risk management
Pros and cons
| 👍 Pros | 👎 Cons |
|
|
|
|
|
|
Final thoughts
SuperTrend indicator can be used for intraday trading, in a scalping strategy, and for trading on medium and long-term timeframes.
Since the price movement on many instruments of the FX market is trending, and the strongest is observed on the D1 period, and above, it is much more efficient from the point of view of extracting the maximum profit to use them in a medium and long-term trading strategy.
Do not forget the importance of using fundamental analysis methods, which involves studying the factors that create price movement. These are cash flows, the interaction of markets with each other, and the public’s mood. Guided by these and many other fundamental factors, a trader will make his work more effective, aimed at making serious profits.




Comments