
In forex trading, price patterns carry explanations of the market context, which makes it easier to predict the future price movement of any target asset. Learning those patterns enables financial traders to increase profitability. The rising wedge stock pattern is among the family of the most effective and reliable patterns.
However, this pattern takes place during both the uptrend and downtrend price movements. So it is worth learning the formation in both trends to make precious trading positions. In this article, we describe the rising wedge stock pattern. A complete guideline to trade using this pattern.
What is the rising wedge stock pattern?
It is a price formation during an upward or downtrend, signaling a possible upcoming declining price movement. You can consider this pattern as a retracement during a declining price trend that signals further downside.
On the other hand, after a solid uptrend, when trends become slower, or the buying pressure decreases, this pattern occurs, and prices decline when sellers take control of the asset price.

The rising wedge pattern concept
Two trend lines need to illustrate this pattern. One will add the lows, and the other will add swing highs, and both trend lines will be converging toward the apex point. This pattern looks similar to the bear flag pattern in some cases. It is popular among financial traders as it has an excellent track record to predict price reversals.
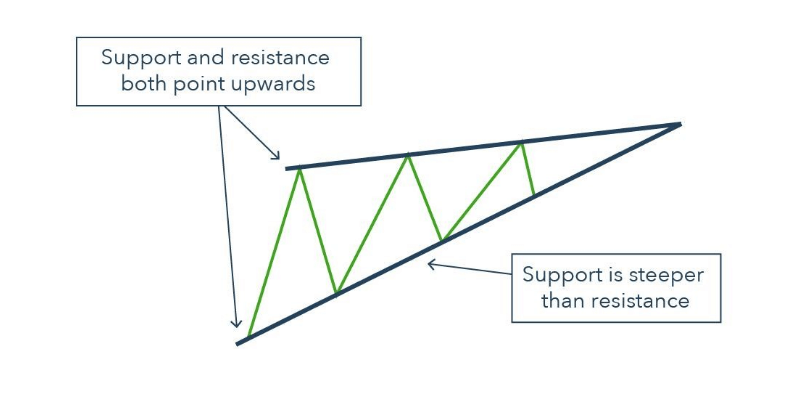
S&R of the rising wedge pattern
When the pattern completes formation as the finishing part comes, the buy volume decreases. The support line or the lower trendline will be steeper than the upper trendline or the resistance line. The rising tops declare that the buyers may be reconsidering the upward movement. Meanwhile, the lower line or bottoms that touch the support line indicate a short-term pulse before a significant downtrend occurs.
How to trade using the rising wedge stock pattern
In this part, we will reveal the complete guideline to trade it. This pattern generates trade ideas for many financial assets such as stocks, currency pairs, commodities, etc.
We recommend using H1 or above time frame charts to get the best trade opportunities using the rising wedge pattern. Using higher time frame charts enables you to avoid fake swing points at smaller time frame charts. You can execute trades using this pattern by following steps.
Step 1. Identify the rising wedge
The initial step is to mark the pattern to execute a trade. You can find this pattern on both a downtrend or an uptrend price movements. The formation or identifying criteria are the same in both. In an uptrend, the price formation will look similar to the figure below.
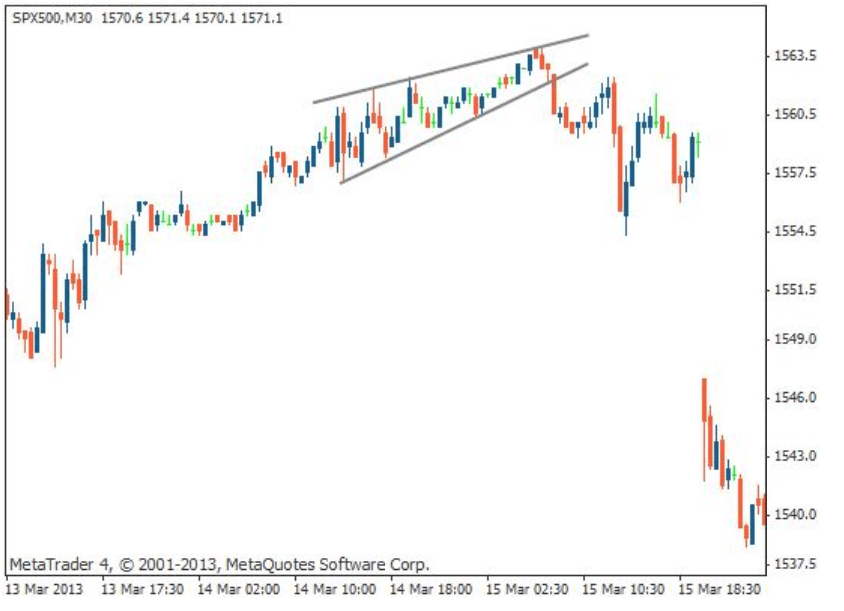
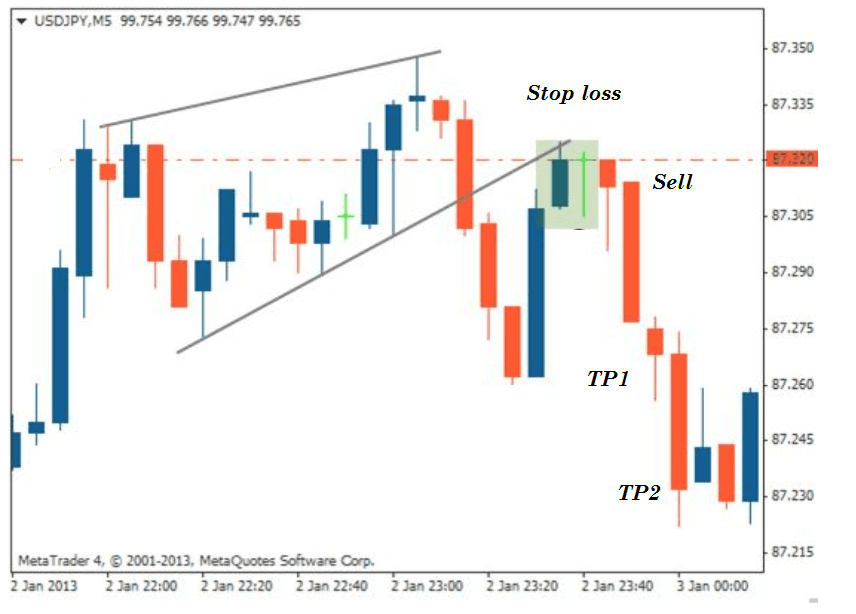
Rising wedge on an uptrend
The lower trendline will add the higher lows, and the upper trendline will add the higher highs. Meanwhile, the price formation will look like the 15-min chart of GBP/USD below in a bearish trend.
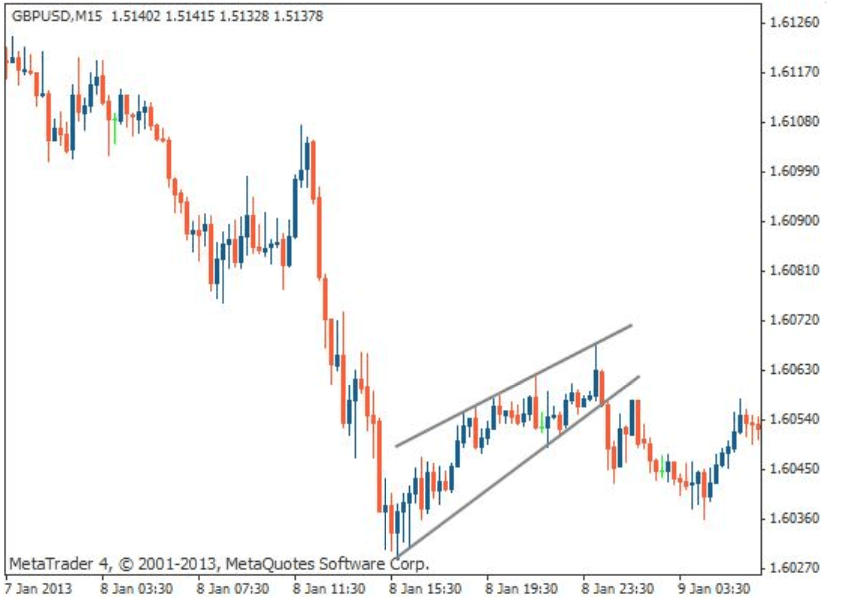
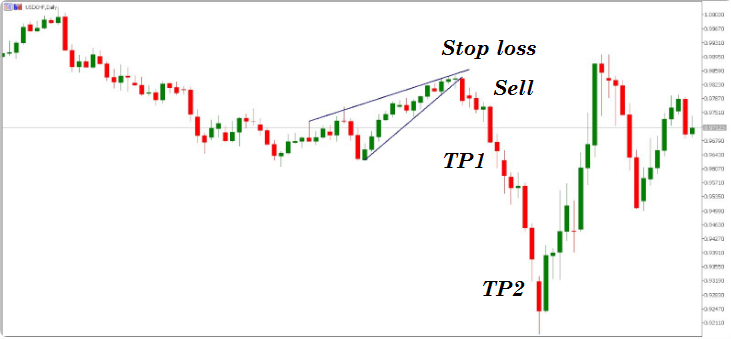
Rising wedge on a downtrend
You can define this pattern as a retracement of a downward movement.
Step 2. Trade setup (method one)
The price will reach near the apex point, then start to decline. It’s time when you will make positions. The price decline below the lower trendline means a valid breakout, and it is the proper place to place a short order on the asset.
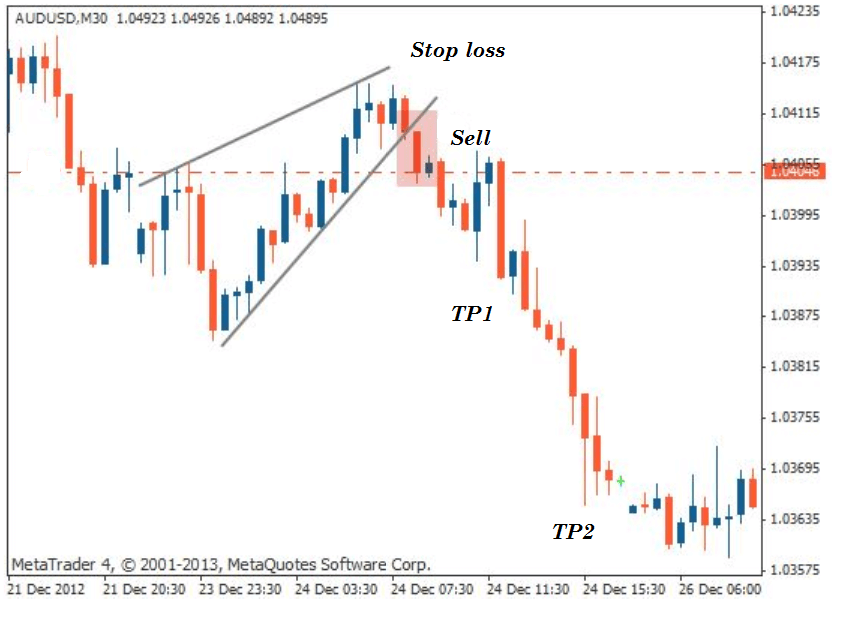
Method one
The stop loss level will be near the upper trendline and above the current swing high level. The profit target for the sell order will be at the support level where the pattern initiates — the starting point of the lower trendline.
Step 3: Trade setup (method two)
Maybe you miss the breakout. Don’t worry, as in most cases, this pattern gives another chance to place short orders. After the breakout occurs when the price bounces back near the lower trendline without sufficient decline, it enables an opportunity to place a sell order.
Method two
This time your stop loss level will be above the lower trendline with a buffer of 10-15pips. Meanwhile, the profit target will remain the same as the previous step. You can continue your sell position as long as the asset price keeps declining.
Step 4: Trade the rising wedge on a downtrend
You already know the formation of this pattern on a downtrend occurs when the price bounces back. Identify the rising wedge pattern on a downtrend and wait till the price breaks the lower trendline level.
Rising wedge on a downtrend
When it comes below that level, the pattern formation completes and is ideal for placing a sell order. In this case, you can use both step two or step three methods depending on market context.
Step 5: Trade management ideas and tips
The winning ratio of this pattern is considerably high. However, using this pattern to enter trades is risky during any trend-changing macro or microeconomic events. You can continue your trading positions till the bearish trend remains intact, and the price continues to decline. In that case, when the price creates a new low on the downside below the initiation of this pattern, you can shift your stop loss at or 2-3pips below the breakeven.
Key points to remember:
- This pattern signals possible selling opportunities on the target asset, either on a bullish or bearish trend.
- You can place a sell order either the price comes below the support level or make that support as resistance.
- Depending on the market context, the stop loss level can be above the upper trendline or below it.
- The primary profit target will be at the distance where the initiation of the pattern takes place. You can continue the sell order till sellers are in control of the asset price.
Final thought
Finally, now you know the entire concept of the rising wedge pattern. We hope you find this article sufficiently educational and informative to use this pattern. This pattern allows you to make quick profits in comparison to other patterns. In most cases, the price reaches the profit target within a short time. Use this pattern wisely and perform some demo trading using this pattern before applying it on live trading.


Comments