
Generating trade ideas using technical indicators is a common practice among crypto investors. Crypto investors rely on many technical indicators while making trade decisions like other financial assets. The Choppiness Index is preferable to financial traders, including crypto investors, for its unique features.
However, it is mandatory to have a particular level of understanding alongside knowing the components and calculation method while choosing any technical indicator to obtain the best results. This article will introduce you to the tool and sustainable trading strategies using it with chart attachments for better understanding.
What is the Choppiness Index indicator?
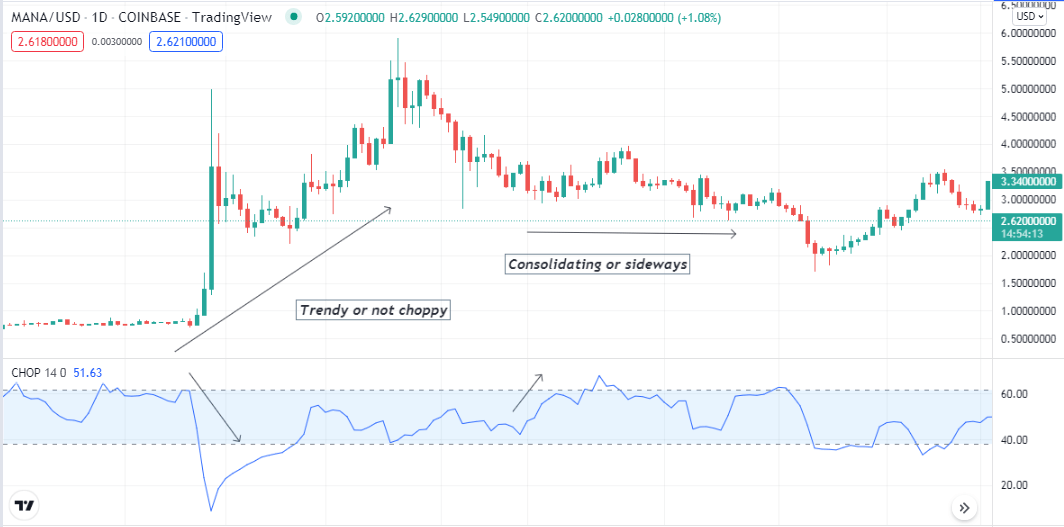
It is a technical tool that helps investors find out the market context according to participants’ actions. This indicator results in an independent window containing a dynamic line that floats between a scale of 0-100. Meanwhile, the indicator window has two levels, 61.80 and 38.20.
Choppiness Index indicator
The indicator sums past N periods’ true range data to measure whether:
- The price moves sideways — choppy market.
- The price is trending — not choppy market or price moving in either direction.
However, the index is a perfect example of a non-directional technical indicator. Crypto investors often use this concept to obtain the market context and determine trading positions.
How to use the Choppiness Index indicator in crypto trading?
It is useful for crypto traders when measuring the market context. Traders usually determine ongoing trends or the strength of current trends to anticipate the trend-changing environment.
- When the index reading surpasses 68.20 level, it declares choppiness or consolidating phase.
- While the reading drops below the 38.20 level displaying a choppy or consolidating market condition.
Crypto investors usually detect the swing levels to enter trades and determine trend continuation phases to continue open positions. You can combine this indicator reading with other technical indicators and tools to execute the most profitable trades.
Short-term trading strategy
We use the MA crossover concept alongside the indicator to identify trading positions in this short-term trading method. We use EMA 10 (green) and EMA 20 (blue) lines and crossover between these lines to confirm the trend-changing levels and combine these readings with the indicator to get complete trade setups. This trading method suits many time frame charts. We recommend conducting analyses on a 15-min or hourly chart to catch the most potential short-term trades.
Bullish trade scenario
Set all three technical indicators at your target asset chart, then observe when:
- The green EMA line reaches above the blue EMA line.
- Both EMA lines head on the upside.
- The dynamic line of the indicator rejects from the upper (61.80) level and starts declining toward the lower (38.20) level.
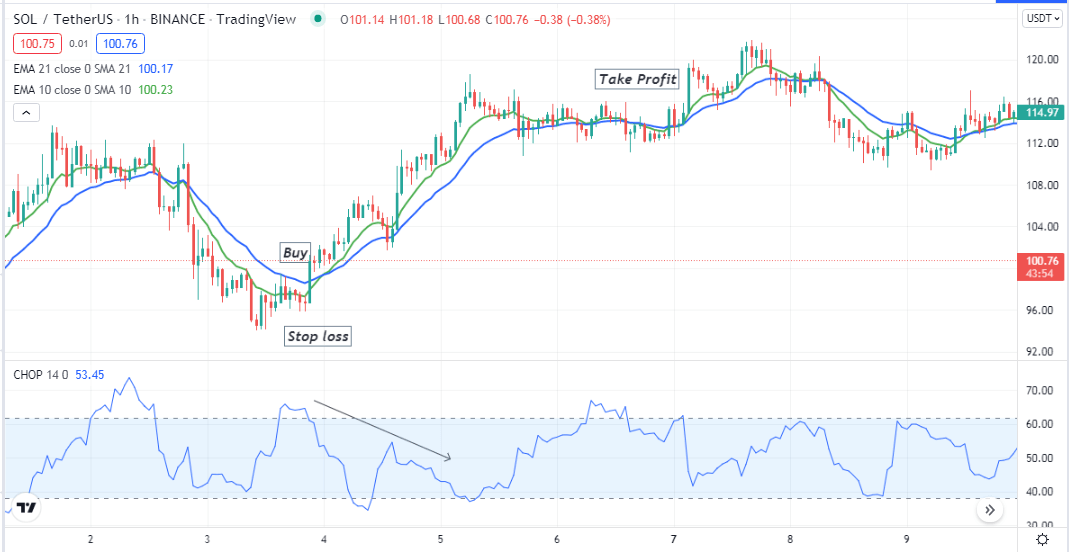
Bullish setup
Entry
When these conditions above match your target asset chart, place a buy order.
Stop loss
Place an initial stop loss below the recent swing low with a 5-10 pips buffer.
Take profit
Close the buy order when:
- The Choppiness Index dynamic line gets below the lower (38.20) level or starts surging upside after reaching that level.
- The green EMA crosses the blue EMA line on the downside.
Bearish trade scenario
Set all three technical indicators at your target asset chart, then observe when:
- The green EMA line reaches below the blue EMA line.
- Both EMA lines head on the downside.
- The dynamic line of the Choppiness Index indicator rejects from the lower (38.20) level and starts rising toward the upper (61.80) level.
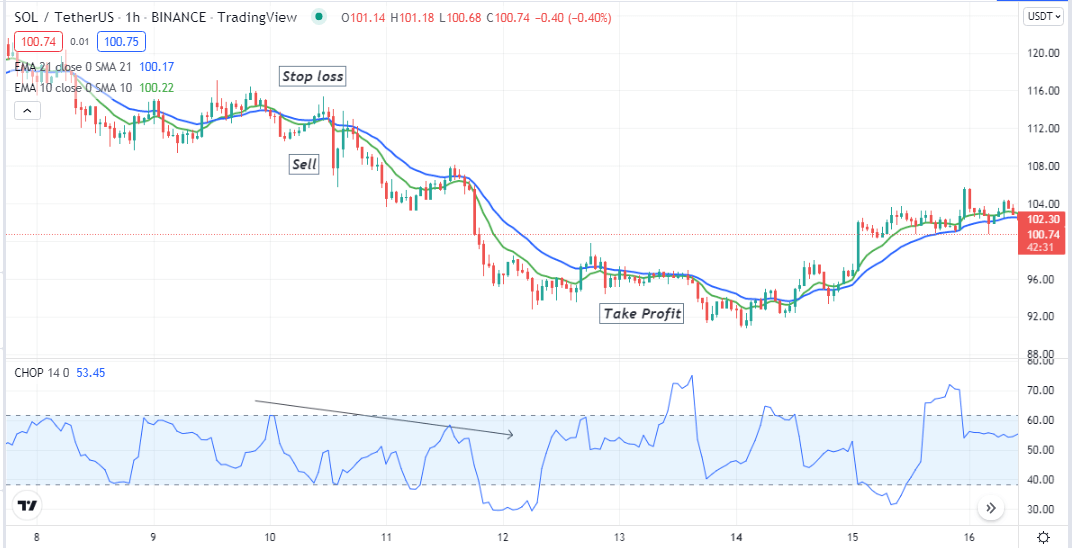
Bearish setup
Entry
When these conditions above match your target asset chart, place a sell order.
Stop loss
Place an initial stop loss above the recent swing high with a 5-10 pips buffer.
Take profit
Close the sell order when:
- The Choppiness Index dynamic line gets below the upper (61.80) level or starts dropping downside after reaching that level.
- The green EMA crosses the blue EMA line on the upside.
Long-term trading strategy
We use two popular technical indicators alongside the Choppiness index indicator in this trading method:
The Parabolic SAR determines the trend switching points. Then we combine all three indicators readings to confirm the trend and continuations. This strategy suits many trading assets, including cryptocurrencies, commodities, stocks, FX, etc. We recommend using a daily or an H4 chart to generate the most potent long-term trading ideas.
Bullish trade scenario
When the dynamic line of the Choppiness Index indicator starts dropping from the upper (61.80) level, observe:
- The dynamic line keeps dropping toward the Choppiness Index indicator’s lower (38.20) level.
- Parabolic SAR dots start making a series below price candles.
- The volume indicator shows buyers’ domination at the asset price.
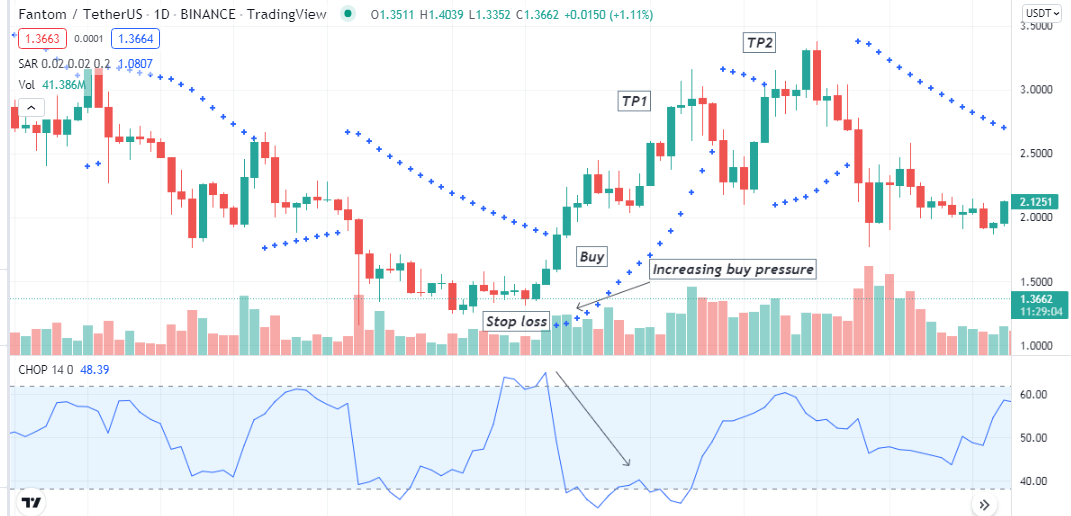
Bullish setup
Entry
When these conditions match your target asset chart, it declares a potential bullish momentum. Open a buy position.
Take profit
Close the buy order when:
- The Choppiness Index dynamic line swings upwards toward the upper (61.80) level.
- Parabolic SAR dot flips on the upside.
- The volume indicator starts creating red histogram bars.
Stop loss
The initial stop loss level will be below the current bullish momentum.
Bearish trade scenario
When the dynamic line of the Choppiness Index indicator starts rising from the lower (38.20) level, observe:
- The dynamic line drops toward the indicator’s lower (38.20) level.
- Parabolic SAR dots start making a series of price candles.
- The volume indicator shows sellers’ domination at the asset price.
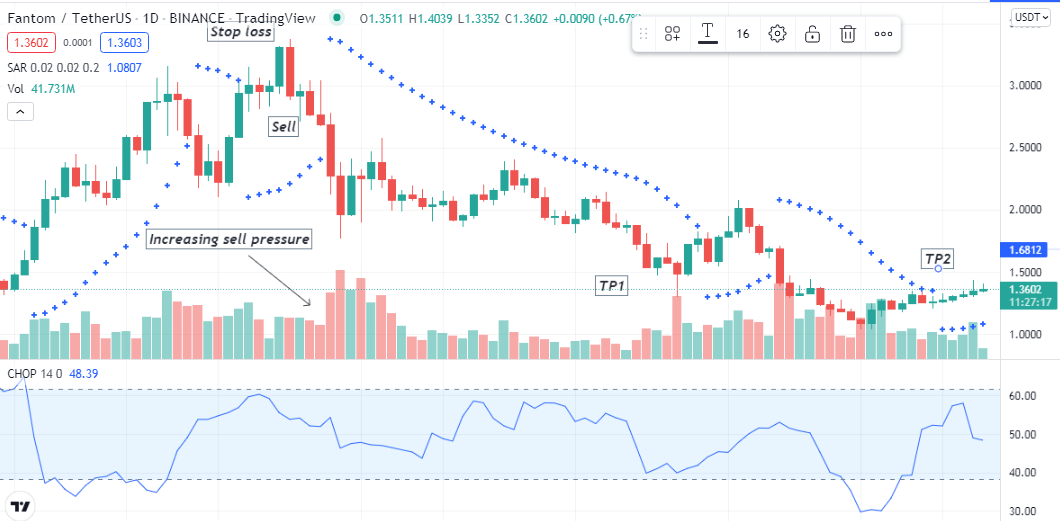
Bearish setup
Entry
When these conditions match your target asset chart, it declares a potential bearish momentum. Open a sell position.
Take profit
Close the sell order when:
- The Choppiness Index dynamic line swings upwards toward the upper (61.80) level.
- Parabolic SAR dot flips on the downside.
- The volume indicator starts creating blue/green histogram bars.
Stop loss
The initial stop loss level will be below the current bullish momentum.
Pros and cons
| 👍 Pros | 👎 Cons |
|
|
|
|
|
|
Final thought
Finally, determining the ‘Chop zones’ is relevant while trading financial assets. So the indicator can help you make enormous profits by utilizing the concept effectively and adequately.


Comments