
Cryptocurrencies are digital payment methods with functionalities like many other financial assets. So no wonder crypto traders who like making frequent trades seek trading positions using many popular existing technical indicators of the financial market depending on effectiveness. The Average Day Range (ADR) indicator is a familiar technical indicator to crypto short-term traders.
However, without learning the effective ways of use, it is not wise to expect to obtain the best results through any trading indicator. This article will introduce you to the ADR indicator using sustainable trading strategies, alongside listing the indicator’s top pros and cons.
What is the Average Day Range (ADR) indicator?
Crypto investors often seek tools to determine the average daily price change of the asset or measure volatility during any specific period. This info helps them make trade decisions either enter, exit, or continue any trade. The indicator is the exact tool for these crypto investors as it shows the ADR value of N-periods.
ADR indicator
This indicator usually works with the daily high-low prices to generate trade ideas. Financial investors frequently use the indicator’s reading to identify the price action outside the average daily move to enter any trades. You can modify the input value as you prefer; financial investors frequently use the value of 20 or 21 periods for the indicator.
How to use the ADR indicator in trading strategy?
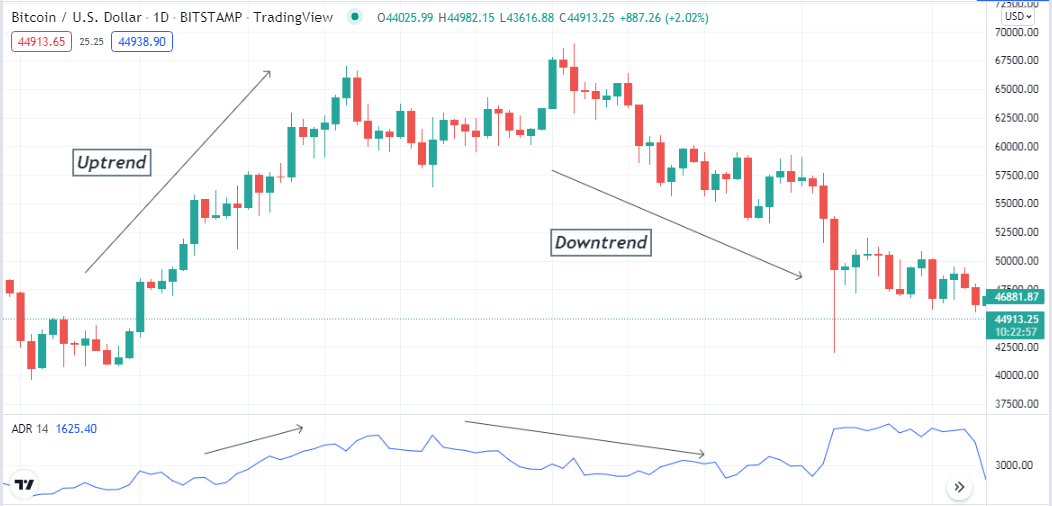
The indicator shows readings on an independent window. The calculation of measurement is so simple it collects specific periods of price-changing data and divides it by that period. The ADR dynamic line heads upside or positive change indicates increasing volatility on the asset price in the same direction. Meanwhile, a negative change or the dynamic line drops, declaring the asset price may lose the current trend’s strength or a consolidation phase as the volatility decreases. You can use this concept independently to generate profitable trade ideas.
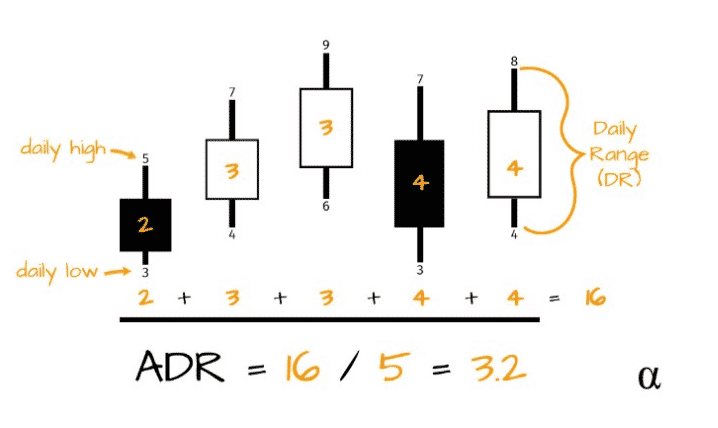
ADR calculation concept
Expert crypto investors often use other technical tools and indicators such as Fibonacci retracement, support resistance, MACD, Parabolic SAR, RSI, Moving average, etc., alongside the ADR indicator to determine more accurate trading positions execute profitable trades.
Short-term trading strategy
We use the parabolic SAR and the RSI indicator alongside the ADR indicator in this trading method. The parabolic SAR defines swing points. Meanwhile, the RSI and ADR indicator declares the current momentum and historical data. So it becomes easier to determine trading positions. This method suits fine on many trading assets on many time frame charts. We recommend using a 15-min or an hourly chart to obtain the best results. Additionally, a multi-timeframe chart analysis before entering trade will increase your profitability.
Bullish trade scenario
Set all indicators at your target asset chart and observe when:
- The ADR indicator reading is positive.
- The parabolic SAR indicator starts making dots below price candles.
- The RSI dynamic line floats near the central (50) level that heads on the upside.
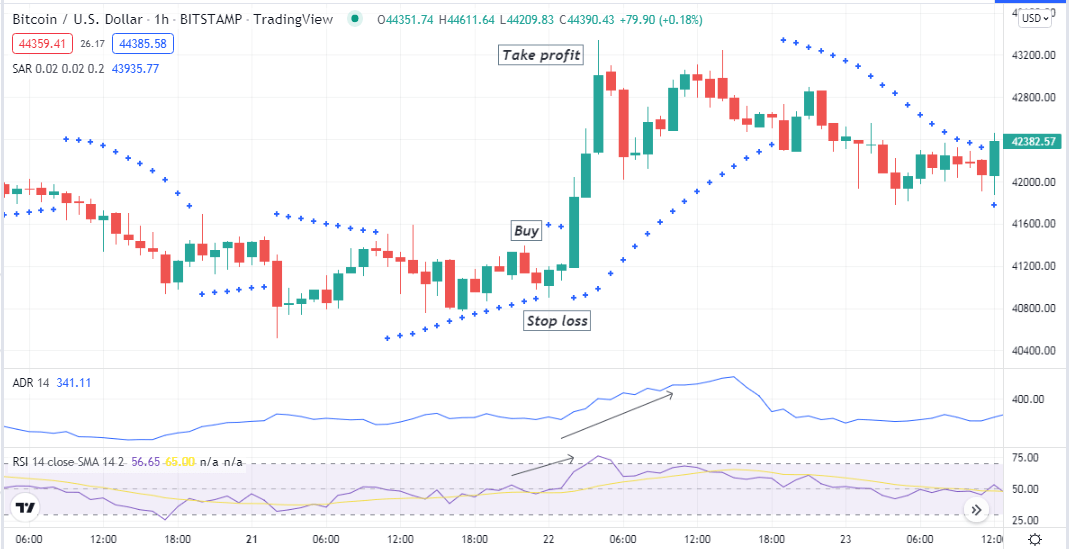
Bullish setup
Entry
These conditions indicate a potential upcoming bullish momentum. Enter a buy trade.
Stop loss
The initial stop loss level will be below the current bullish momentum.
Take profit
Close the buy order when:
- The ADR indicator starts showing negative readings.
- The parabolic SAR dots switches on the upside of price candles.
- The RSI dynamic line reaches above the upper (70) level or starts to drop after getting that level.
Bearish trade scenario
Set all indicators at your target asset chart and observe when:
- The ADR indicator reading is negative.
- The parabolic SAR indicator starts making dots above price candles.
- The RSI dynamic line floats near the central (50) level that heads on the downside.
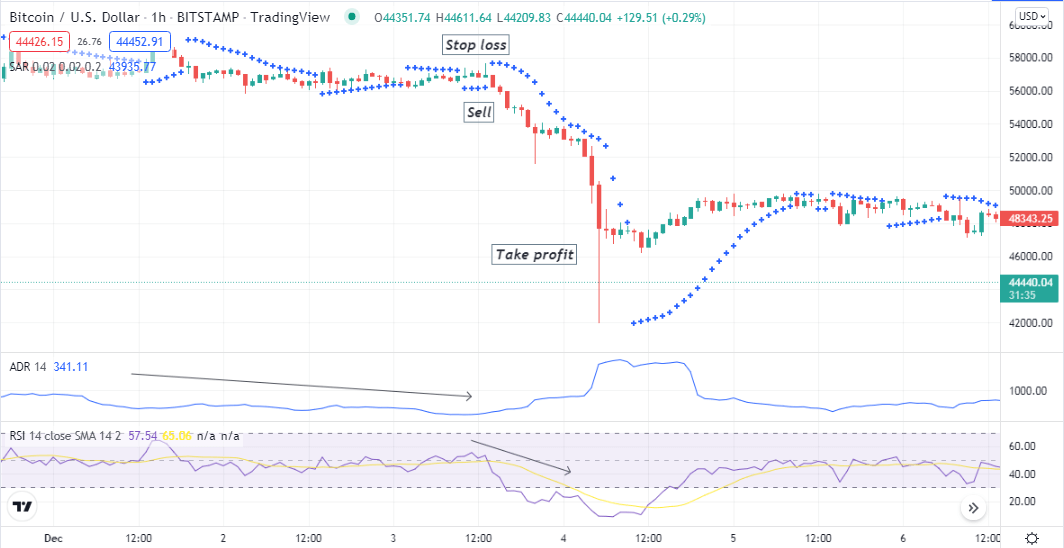
Bearish setup
Entry
These conditions indicate a potential upcoming bearish momentum. Enter a sell trade.
Stop loss
The initial stop loss level will be above the current bearish momentum.
Take profit
Close the sell order when:
- The ADR indicator starts showing positive readings.
- The parabolic SAR dots switches on the downside of price candles.
- The RSI dynamic line reaches below the lower (30) level or starts to surge upside after getting that level.
Long-term trading strategy
This trading method uses the volume indicator and an HMA (20) line alongside the ADR indicator. We recommend using a daily or an H4 chart to obtain the best results through this trading strategy.
Bullish trade scenario
This trading method suggests bullish momentum when:
- The ADR indicator starts showing a positive change.
- The volume indicator declares an increasing buy pressure.
- Price candles start closing above the HMA line, and the HMA line slopes on the upside.
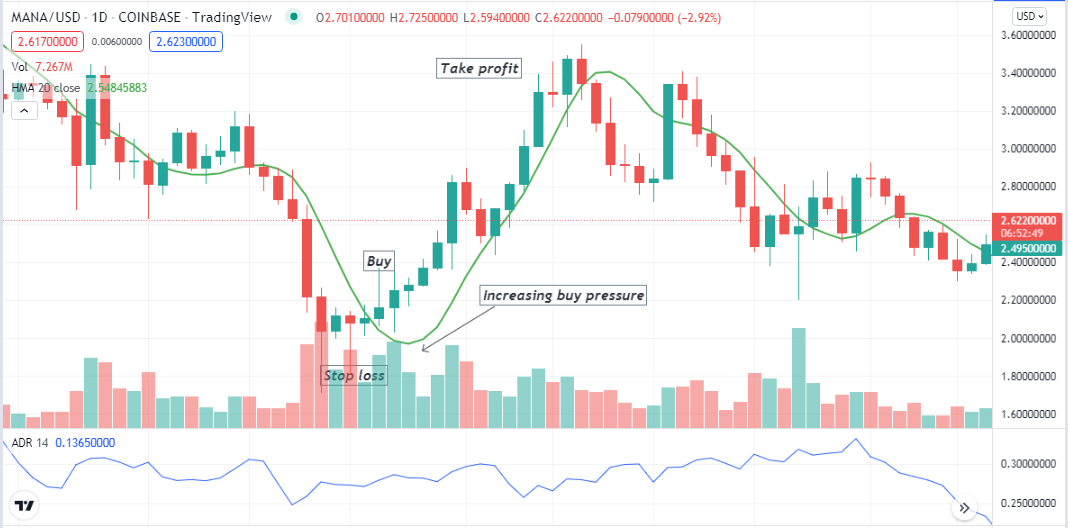
Bullish setup
Entry
Match these conditions above and open a buy trade.
Stop loss
Place an initial stop loss below the recent swing low.
Take profit
You can continue your buy position until the current uptrend remains intact. Close the buy order when:
- The ADR indicator reading starts showing negative results.
- The volume indicator declares an increasing selling pressure.
- Price candles start closing below the HMA line, and the HMA line slopes on the downside.
Bearish trade scenario
This trading method suggests bearish momentum when:
- The ADR indicator starts showing a negative change.
- The volume indicator declares an increasing sell pressure.
- Price candles start closing below the HMA line, and the HMA line slopes on the downside.
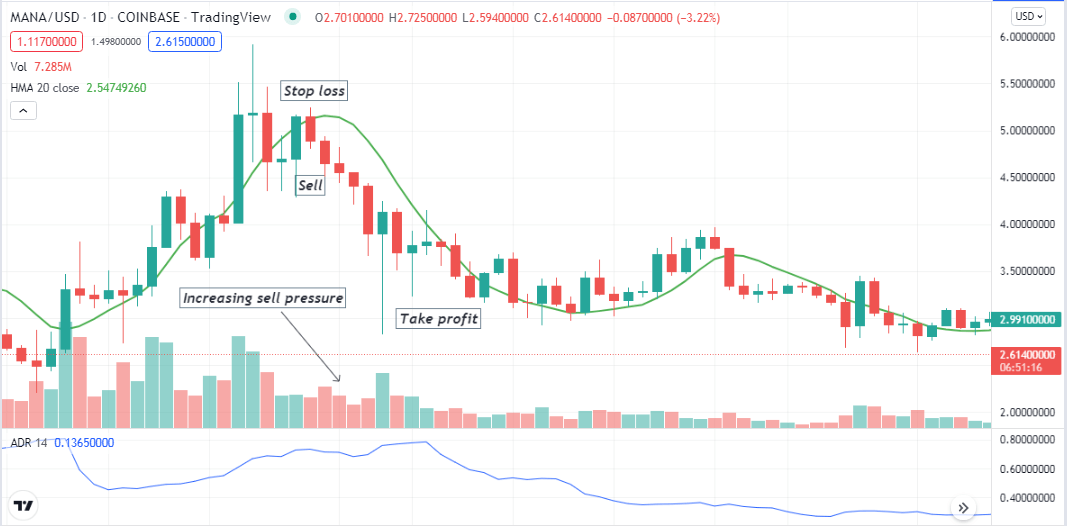
Bearish setup
Entry
Match these conditions above and open a sell trade.
Stop loss
Place an initial stop loss above the recent swing high.
Take profit
You can continue your sell position until the current downtrend remains intact. Close the sell order when:
- The ADR indicator reading starts showing positive results.
- The volume indicator declares an increasing buying pressure.
- Price candles start closing above the HMA line, and the HMA line slopes on the upside.
Pros and cons
| 👍 Pros | 👎 Cons |
|
|
|
|
|
|
Final thought
Using the ADR indicator, these invincible trading strategies can help you catch many profitable trades and make enormous profits trading crypto-assets. We suggest practicing and mastering the concept before applying these methods to live accounts.


Comments